The cost of poor code quality: How maintainability impacts your bottom line
In this article
Summary & key takeways
- Poor code quality is expensive not only in monetary terms but also in terms of missed opportunities.
- Maintainability drives innovation, and security is the bridge between engineering and business performance.
- Governance matters. What gets measured gets improved.
When code becomes a cost driver instead of a business enabler
Software is meant to accelerate your business and not slow it down. But over time, as codebases grow, every new feature, patch, or integration becomes harder, riskier, and more expensive to deliver.
The culprit isn’t a lack of developers or tools. It’s something less visible, yet more impactful: poor code quality.
When build quality declines, the cost of every change increases. Teams spend more time fixing and testing, less time innovating. Overheads rise, deadlines slip, and the software portfolio gradually transforms from a competitive advantage into a liability.
In short: Poor code quality incrementally increases operational cost and risk.

The hidden economics of poor maintainability
Most organizations underestimate how much low maintainability costs them. Poor build quality doesn’t appear in financial statements; it hides behind “maintenance hours” and “technical debt.” But those categories conceal a major operational drain. However, as we described in another article, code quality can be measured by looking at maintainability.
The real-world impact
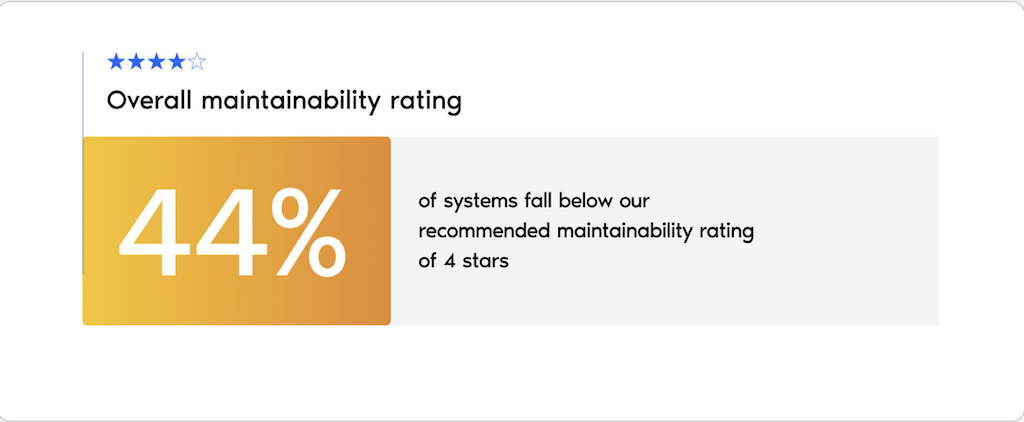
According to our latest State of Software report, 44% of systems fall below the recommended maintainability threshold.
Achieving a high maintainability rating has been shown to accelerate delivery, reduce risk and expenses, enhance the security of your systems twofold, and even boost the ability to innovate.
The effect of having a low maintainability score is significant:
- Up to €250,000 in unnecessary maintenance costs per system, per year.
- For large enterprise systems, this number climbs as high as €7 million annually.
That waste compounds across portfolios. In an enterprise with 50 systems, improving maintainability to the recommended 4-star level could unlock millions in recovered value each year.
The equation is simple:
Higher maintainability → fewer change failures → lower total cost of ownership.
Maintainability = innovation capacity
Beyond the financial hit, poor maintainability taxes innovation. Teams stuck in reactive maintenance have less time for transformation, AI initiatives, or modernization.
Our data shows a clear link between maintainability and both development speed and system costs.
For example, maintenance/ownership costs for 4-star systems are two times lower than for 2-star systems, and their development speed is up to four times faster.
→ Every hour spent fixing fragile code is an hour not spent creating business value.
High maintainability creates space for progress. It’s the foundation of agile, future-ready organizations. In practice, that means the difference between companies that can experiment with new technologies and those that can’t.
The risk multiplier: security, compliance, and reliability
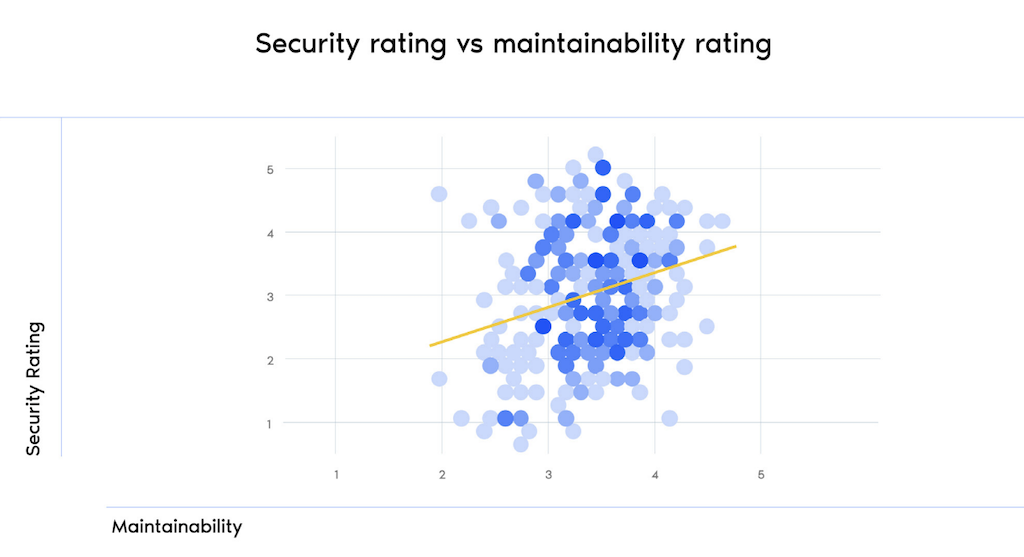
That’s no coincidence: maintainability enables resilience. In our latest State of Software report, we discovered that poor quality software is closely associated with an increased number of security vulnerabilities. Software systems that exhibit above-average build quality in the market (receiving a high maintainability rating) are twice as likely to achieve strong security compliance.
Why it matters:
- Security: maintainable code allows faster vulnerability fixes and reduces the attack surface through cleaner, more predictable code paths.
- Reliability: modular, testable systems recover faster from failure and have a lower mean time to resolution (MTTR).
- Compliance: maintainability simplifies audits and traceability by providing clear code documentation and change history.
A fragile system can be an unsafe system. Treating maintainability as a governance metric closes the gap between IT risk and business accountability.
How Software Improvement Group helps you quantify the ROI of maintainability
The most effective organizations treat maintainability like any other investment — measurable and governed.
→ Step 1 – Baseline your current maintainability
We can assess the maintainability of your entire portfolio with our easy-to-understand, yet technical, fact-based, and unbiased 1–5 star model. Software Improvement Group’s TÜViT-certified method quantifies maintainability across dimensions like modularity, analyzability, and testability.
→ Step 2 – Estimate the total cost of poor quality
Use benchmarks to translate maintainability scores into real-world costs. Each star improvement typically reduces maintenance effort by 15–25% per year, with a 40% cost reduction average for systems moving from 2-star to 4-star ratings.
→ Step 3 – Model the ROI
As Cor van Herk, the IT Director at Keylane, pointed out during our IT-leadership event. “Measuring ROI is really hard because the return on investment is based on multiple variables”.
We attempted to make this a bit easier with our free-to-use Sigrid® ROI Calculator for Software.
Our calculator considers several aspects that affect your IT spending and potential savings, such as:
- IT budget: Gain insights into how effectively your IT budget is being utilized.
- IT maturity: Assess the maturity of your IT processes and infrastructure.
- Legacy software: Evaluate how outdated systems impact your budget.
- Number of developers: Examine the productivity and cost-efficiency of your development teams.
By using Software Improvement Group’s ROI calculator, you can estimate savings from maintenance costs, boosts productivity, and the duration for ROI payback, in less than a minute.
Explore Sigrid®, our software portfolio governance platform, to benchmark maintainability across your entire portfolio