Frequently asked questions
How does Sigrid Core measure code quality?
Sigrid Core compares your source code against a benchmark of 40,000+ industry systems and more than 600 billion lines of code, recalibrated every year to reflect the current state of software development, covering old and new technologies, legacy and modern frameworks alike. Because the benchmark is technology-independent, you can compare a COBOL system and a React app on the same scale, normalized to how much developer effort each represents. The result is a 1–5 star rating from our quality models that shows how your code compares to the rest of the market.
What does the star rating actually mean?
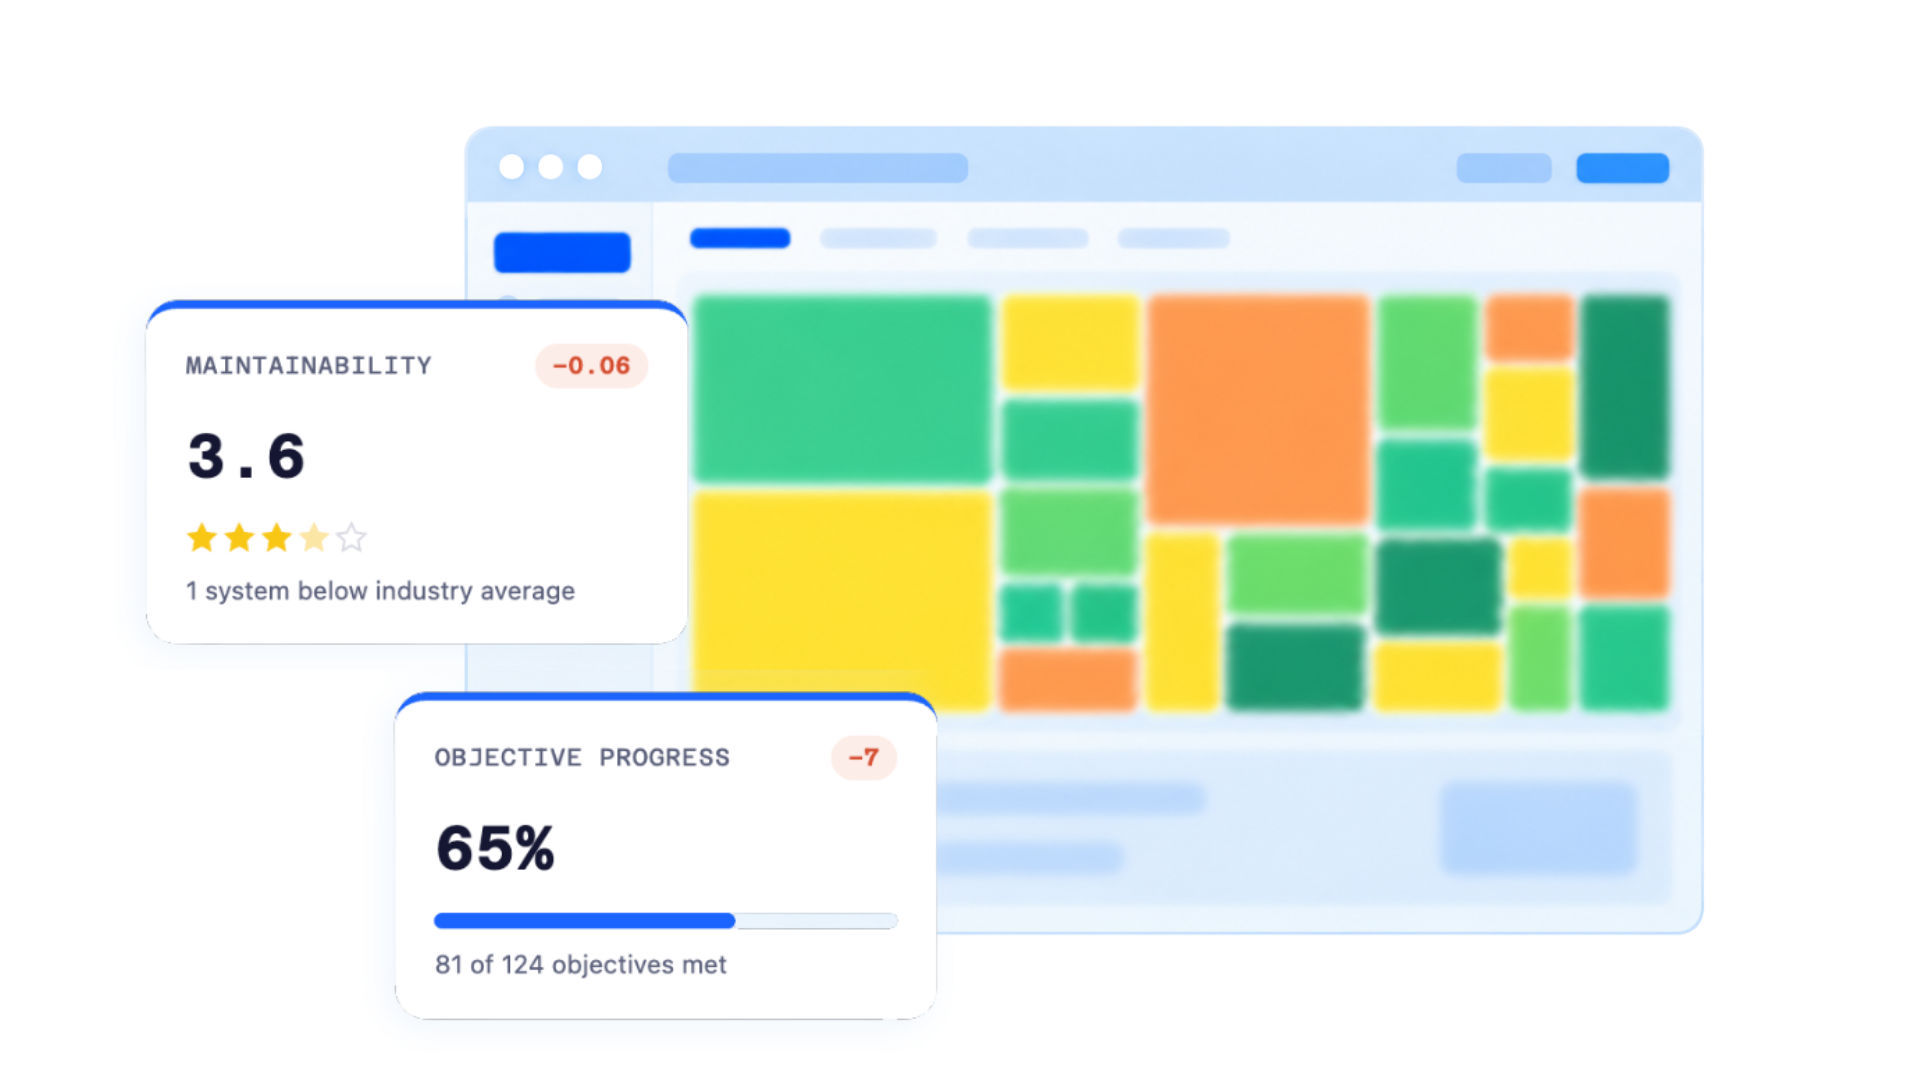
3 stars marks the market average, the point where most systems land. The scale follows a fixed 5%–30%–30%–30%–5% split, so 3 stars covers a defined middle band (2.5–3.5), with the bottom 5% at 1 star and the top 5% at 5. Scores always round down, never up. A 4.49 stays at 4 stars instead of rounding up, and a fractional score like 3.4 means "solid, upper end of average" rather than "almost a 4."
What is software architecture, and why does Sigrid Core measure it?
Software architecture is how a codebase is divided into components based on responsibility, and how those components depend on each other. It's the layer where individual functions and files stop mattering and the relationships between them start to matter, because that's where the expensive problems live. A single messy function costs a few hours to fix. A codebase where everything depends on everything else costs months, and by the time it's visible, a routine change breaks something three systems away.
How does Sigrid Core measure architecture quality specifically?
Five categories, nine measurable properties in our architecture quality model: structure, communication, data access, evolution, and knowledge. These cover code breakdown, component coupling, component adjacency, component cohesion, communication centralization, data coupling, bounded evolution, knowledge distribution, and component freshness. All nine come from static code analysis and repository history, measuring how the architecture actually behaves rather than how a diagram says it should.
How is Sigrid Core's security assessment different from a penetration test?
Sigrid Core looks from the inside out, examining the source code and infrastructure itself rather than probing the system from the outside. That gives it high predictive value for finding why a vulnerability exists, which complements rather than replaces external pen testing. Findings are scored with CVSS and mapped to the OWASP Top 10, so you get both the severity and the specific risk category.
What does the security star rating mean?
It's a 1–5 scale from our security model reflecting how well security best practices are built into the design and implementation, from severely low controls at 1 star to a high degree of control at 5. Even a 5-star rating isn't a guarantee of zero vulnerabilities. It means security was systematically factored into design and implementation.
What security standards does Sigrid Core align with?
OWASP ASVS, OWASP Top 10, NIST SP800-53, PCI-DSS, CIS/SANS Top 20, and CWE, all underpinned by ISO/IEC 25010's security model, grouped into confidentiality and integrity, non-repudiation and accountability, and authenticity. Sigrid Core acts as a gateway into these frameworks, surfacing where your code falls short and which standard that shortfall maps to.
What can I actually see on the Management Dashboard?
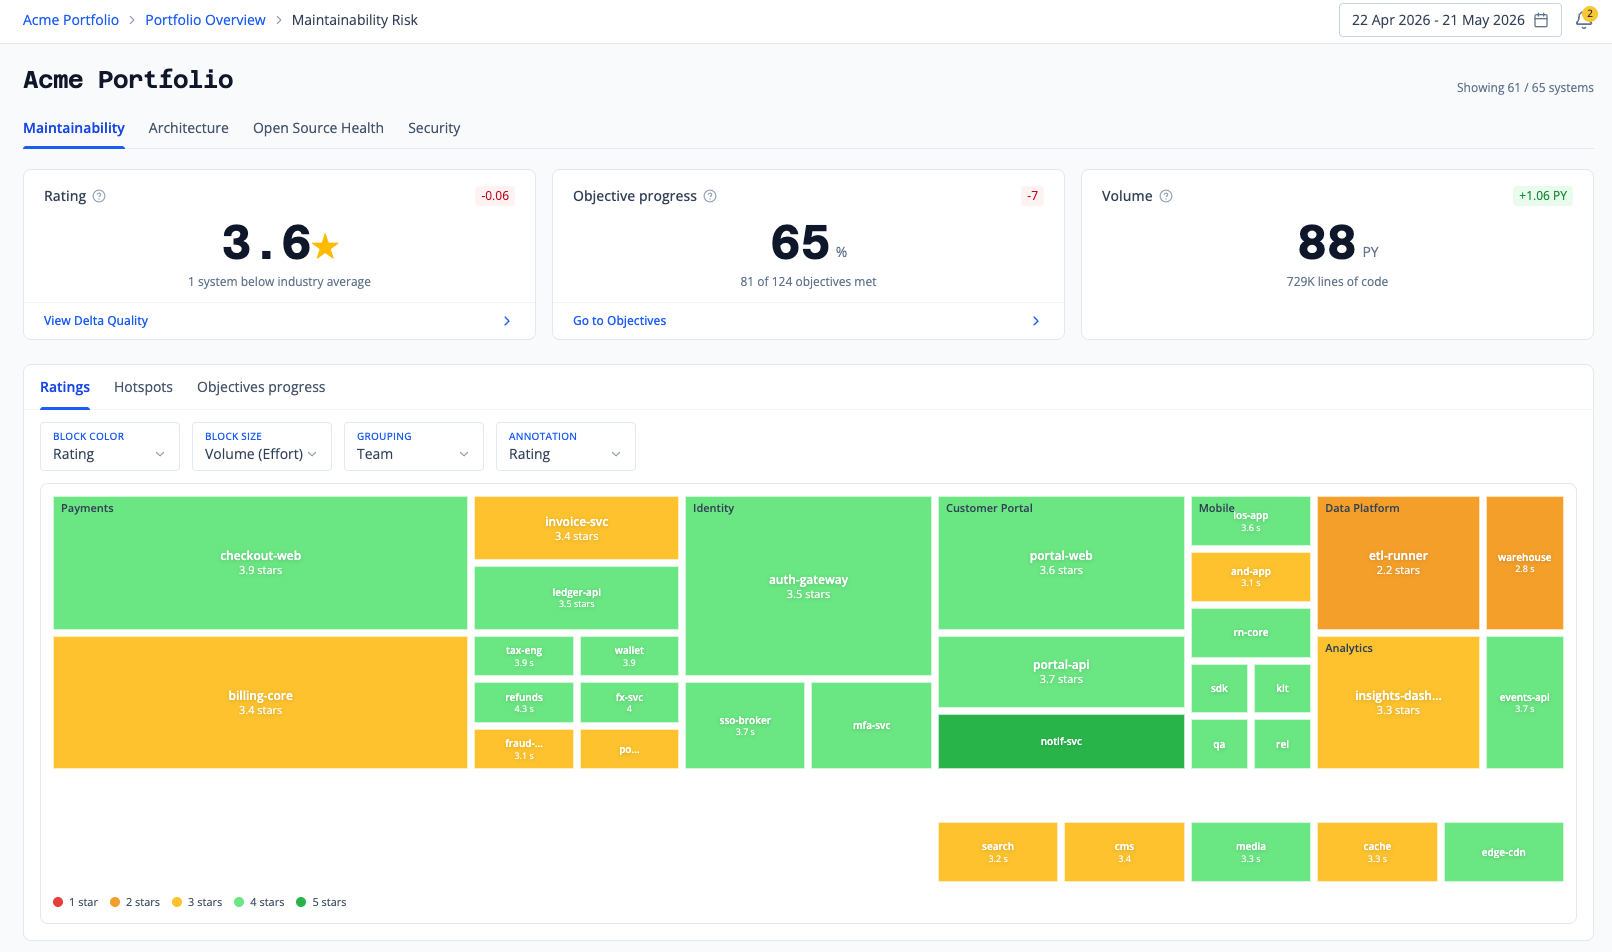
A portfolio-level view that turns technical signals into business questions: where you have acute risk that needs attention now, where to prioritize next, and whether you're on track against the targets you've set. Security posture, technical debt, IT spend, development activity, and productivity all roll up into KPIs a CIO or board can act on without translating them first.
What are objectives in Sigrid Core?
Targets you set for where your systems should be: desired maintainability, new-code quality, minimum test coverage, or maximum tolerated vulnerabilities in a library. Apply them to whichever group of systems shares a trait you care about (technology, business criticality, lifecycle stage). Once set, every system in that group is measured against the target automatically, so drift shows up before it becomes a conversation you have to start yourself.
How does Sigrid Core help manage open-source library risk across a portfolio?
One view answers the questions that usually take a spreadsheet and a Slack thread to piece together: which libraries are in use across the whole portfolio, which systems are running versions with known CVEs, which teams have fallen behind your version policy, and exactly which systems are exposed if a library like Log4j turns out to be compromised. Portfolio-wide, not system by system.
Who is Sigrid Core actually built for?
Whoever's asking has a different question. Executives and portfolio managers want a landscape-level view of risk and health to steer investment, and enterprise architects get that same view plus the ability to drill into any system for root cause. Product owners track delivery predictability over time. Developers want the specifics: which components are hardest to change, and why. One dataset, four sets of answers.
Can you easily export reports?
Yes, generated reports export as PowerPoint or Word, so the numbers can slot straight into a board deck, a steering committee update, or an audit trail without anyone re-typing anything. You can pull a snapshot of current state, a change report showing how metrics moved over a period, or a process/metadata report, and share or archive it offline.