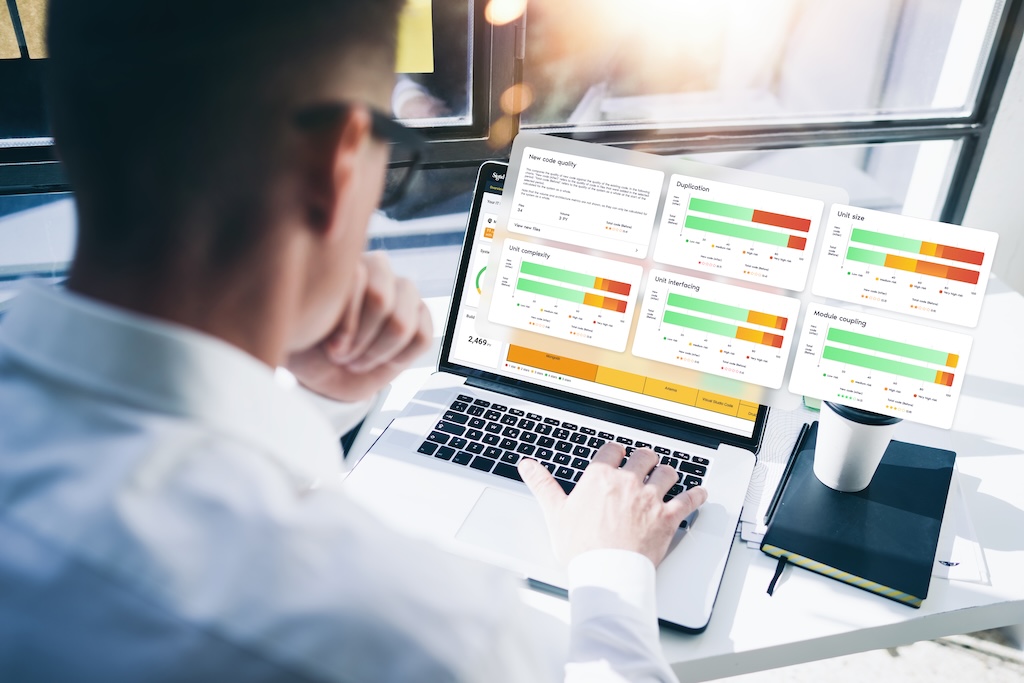
Gain clear, actionable insights into your code quality, maintainability, and technical debt.

Sigrid provides an in-depth source code analysis at both portfolio and system level. This dual option allows you to understand the overarching maintainability score of your software portfolio, as well as drill down into specific systems.
Poor code quality is the source of difficult-to-maintain systems that leads to costly delays and defects. Visual tools within Sigrid highlight areas of high technical debt, enabling you to prioritize efforts where they will have the most impact—from boosting maintainability to developer productivity.


Sigrid provides a detailed source code analysis aligned with globally recognized maintainability standards (ISO 25010) and benchmarks your code against the world's largest code database. This enables you to set realistic maintainability goals and track code quality improvements over time.
Sigrid utilizes AI to provide detailed explanations and actionable advice tailored to each technology, drawing from a vast knowledge base and best-in-class public data sources.

Ensure your IT objectives directly support your overarching business strategy.
Encourages continuous improvement while fostering a culture of software excellence.
Address pressing issues before they escalate by monitoring risk-related IT objectives.
Set and share clear IT objectives that are understandable across IT and business stakeholders.

As management, we wanted to ensure that the entire code that has been delivered would remain maintainable and cost effective. The journey with SIG gives us many deep insights and helps us to keep our MAGDA platform future proof.”

It is of great importance to us that the software we develop ourselves, as well as the software that is developed for us, is independently tested and compared with an international benchmark”

“Making sure that you create maintainable software but also taking the security and vulnerability part into account by scanning your code is key. For us, but also our customers. It allows us to showcase that we’re in control.”
Relevant resources


Finding an objective measure of code quality is tough. High quality software behaves the way you expect it to, can withstand unforeseen situations, is secure against abuse, and complies with code quality standards.
What all these have in common is the need for maintainability. This is the honorable task of developers and the roles surrounding them. Efficient, effective, workable code, easy to read even. That is, easy for the developers that come after you (code readability). When we talk about technical debt, it is easy to imagine its compounding effects, where over time it gathers interest over the original debt, the technical imperfections of code. The metaphor does not stretch limitlessly, since not all debt must necessarily be recovered (this is essentially a business trade-off). But it is well-understood (“cruft” never quite made it past developer argot). Technical debt might be just harmless unrealized potential, but we often see that at a certain point, teams get stuck in a vicious cycle. Then, poor code quality becomes very noticeable to developers, clients and the business. See also our discussion on technical debt in an agile development process.. Essentially, bad quality of code is bad for business. The inverse is not necessarily always true, but it is certain that you need to have a grip on code maintainability to deliver business value in a predictable and efficient way.
Generally, to assess the quality of code, you need a sense of context. Each piece of software may have a widely different context. To put objective thresholds on code quality measurement, at SIG we use technology-independent source code analysis and compare those to a benchmark. A benchmark on code quality check is meaningful because it provides an unbiased norm of how well you are doing. The context for this benchmark is “the current state of the software development market”. This means that you can compare your source code to the code that others are maintaining.
To compare different programming technologies with each other, the metrics represent a type of abstractions that occur universally, like the volume of pieces of code and the complexity of decision paths within. In this way, system size can be normalized to “person-months” or “person-years”, which indicate the amount of developer work done per time period. Those numbers are again based on benchmarks.
Sigrid compares analysis results for your system against a benchmark of 30,000+ industry systems. This benchmark set is selected and calibrated (rebalanced) yearly to keep up with the current state of software development. “Balanced” here can be understood as a representative spread of the “system population”. This includes anything in between old and new technologies, from anything legacy to modern JavaScript frameworks. In terms of technologies this is skewed towards programming languages that are now most common, because that best represents this current state. The metrics underlying the benchmark approach a normal distribution. This offers a sanity check of being a fair representation and allows statistical inferences on “the population” of software systems.
The code quality measurement score compared to this benchmark is expressed in a star rating on a scale from 1 to 5 stars. It follows a 5%-30%-30%-30%-5% distribution. Technically, its metrics range from 0.5 to 5.5 stars. This is a matter of convention, but it also avoids a “0” rating score because 0 is not a meaningful end on a code quality standards scale. The middle 30% exists between 2.5 and 3.5, with all scores within this range rated as 3 stars, representing the market average.
Even though 50% of systems necessarily score below average (3.0), 35% of systems will score below the 3-star threshold (below 2.5), and 35% will score above the 3-star threshold (above 3.5). To avoid a suggestion of extreme precision, it is helpful to think about these stars as ranges, such that 3.4 star would be considered “within the expected range of market average, on the higher end”. Note that calculation rounding tolerances are always downwards, with a maximum of 2 decimals of precision. So, a score of 1.49 stars will be rounded down to 1 star.
Based on our data, a 4-star system compared to a 2-star system can see up to 50% lower maintenance costs, up to 4 times faster implementation of business changes, and up to 4 times faster resolution of defects. In short, improve code quality and high code maintainability result in tangible business value.
Our research shows that low code maintainability (e.g. 2-star systems) can lead to a 40% capacity shortage for regular maintenance. In contrast, high maintainability (4-star systems) can free up to 30% extra capacity for innovation and improvement.
We recalibrate our code quality measurement benchmark yearly, drawing from our dataset of thousands of systems. This ensures our ratings stay relevant as industry practices evolve.
Yes, SIG works with TÜViT for certification of our software reliability engineering model. We're proud to be the only fully certified laboratory in the world to measure against the ISO 25010 standard for software reliability and code quality standards.