
Executive summary
Key findings: State of Software 2026
- AI-generated code now accounts for 1.9% of enterprise production code
- AI-generated code carries roughly double the security risk violations of human-written code
- AI-generated code is less maintainable than human-written code, especially in large systems
- Today, non-agentic AI token spend for a team of 50 developers costs the equivalent of nearly one additional developer per year
- Agentic coding tasks can consume up to 1,000 times more tokens than standard code chat or reasoning
- 86% of code falls below our recommended maintainability rating
- Reducing code-level technical debt can save €870,000 in developer time, per system, per year
- 71% of code has a low degree of security controls
- Systems with lower code-level technical debt can have up to 72% stronger security compliance
- 50% of code scores below our recommended architecture quality rating
- Strong architecture reduces issue-resolution time by 30%
- Roughly 1.5% of enterprise systems qualify as an AI system
State of Software 2026 is Software Improvement Group's annual benchmark report on enterprise software quality. Drawing on the systems SIG analyzed in Sigrid® over the past year, rated against a benchmark of more than 30,000 systems, it finds that AI-generated code makes up 1.9% of enterprise production code, carries roughly twice the security risk violations of human-written code, and is less maintainable, especially in large systems.
Three years ago, a developer using AI to write code felt novel. In 2026 it is the default. 90% of technology professionals now use AI at work, agentic tools are moving from pilots into production, and the volume of code entering organizations is rising faster than at any point in the history of software.
The capacity to review that code hasn't kept up, and technical debt is rising as a result. That's the central subject of this report.
The report draws on Software Improvement Group (SIG) benchmark data, set against the best independent research available. SIG's benchmark spans more than 30,000 systems and over 400 billion lines of code; the 2026 edition draws on systems analyzed in the year before publication.
A pattern runs through all six chapters. AI compounds whatever discipline an organization already has. Where quality is measured and managed, AI accelerates delivery. Where it is not, AI accelerates debt, cost, and exposure at the same speed.
The organizations that capture the productivity gains without inheriting the risk share one trait. They can see what they are running. They measure quality continuously, gate it before code reaches production, and prioritize remediation by business impact.
Foreword
Software runs the business. That has been true for years, but in 2026 it is true in a way that demands a different kind of attention from anyone responsible for technology. Because who runs the software?
This was the year AI-assisted coding went fully mainstream, and the year agents began to write, test, and merge code with less and less human involvement. The way code enters an organization has fundamentally changed. More of it arrives, faster, from more sources, and often without a clear record of where it came from or who, or what, wrote it.
None of what's in this report is an argument against AI. The productivity gains are real, and the organizations that step back from AI will fall behind the ones that learn to use it well. The argument is for seeing clearly. You cannot manage what you cannot measure, and you cannot move fast for long on a foundation you do not understand.
While the volume of code is rising sharply, the human capacity to review it is not. When generation outruns governance, the result is predictable: technical debt accumulates faster, security exposure widens, and the systems a business depends on become harder to change at exactly the moment change matters most.
The findings on the pages that follow come from real benchmark data across tens of thousands of systems, set against the best independent research available. Some of it is encouraging. Much of it should give pause.
All of it is meant to help you go faster—responsibly.

Luc Brandts
Group CEO, Software Improvement Group and EXIN
Chapter 1
AI coding
Key findings: AI coding
- 1.9% of enterprise code in production is AI-generated
- AI-generated code carries twice the security risk violations of human-written code
- AI-generated code is less maintainable than human-written code, especially in large systems
- Agentic code experiments produced functionally impressive results but scored lower on maintainability and architecture
- Today, non-agentic AI token spend for a team of 50 developers costs the equivalent of nearly one additional developer per year
- Agentic coding tasks can consume up to 1,000 times more tokens than standard code chat or reasoning
Introduction
Three years ago, a professional developer using AI felt novel; today, it's expected. 90% of technology professionals now use AI at work and according to BCC research, organization-wide adoption is on track to reach 40% in 2026, up from 22% in 2025.
The shift is just as visible in the enterprise. A16Z research finds that almost one-third of the Fortune 500 and one-fifth of the Global 2000 now run enterprise AI deployments, and that the primary use case, by far, is coding.
While AI coding assistants draft code, suggest fixes, and speed up routine tasks, agentic AI is on the rise to take over these tasks entirely. The promise is appealing: digital software "workers" that can plan, write, test, and repair code on their own.
The individual productivity gains are real. 52% of developers say AI tools or agents have had a positive effect on their productivity, and according to DX's Q1 2026 report, developers save an average of 3.9 hours per week with AI coding tools. Yet only 29% of organizations see significant ROI from generative AI, and just 23% from AI agents.
Potential speed is only half the story. If agents can build an entire system in days, what kind of system does it produce? Organizations must weigh these efficiency gains against quality metrics, or risk undermining the long-term velocity they were chasing in the first place.
Generative models learn from market-average code and pattern matching. They usually produce convincing results. However, many professional developers say they distrust AI answers more than they trust them, and the most experienced developers are the most cautious. In practice, a lot of AI output is almost right, and "almost right" still costs time and tokens to verify and correct.
How much enterprise production code is AI-generated?
In SIG's benchmark, 1.9% of enterprise production code is AI-generated, based on automated detection across Java, C#, and Python.
Sigrid® uses a machine learning classification model that is trained on a set of stylometric features of AI-generated and human-written code. Examples of stylometric features are line length, number of blank lines, indentation, casing, and similar source code characteristics. Sigrid takes into account over 90 different stylometric features and is able to identify AI-generated code with an accuracy of over 95%. SIG's AI detection capability is currently available for three common enterprise languages: Java, C#, and Python, so the figures reflect detected AI-authored code and likely understate its true share.
1.9% may look modest next to broader industry figures, but it is important to understand this is 1.9% of an entire body of enterprise production code, most of it written over years and decades, long before these tools existed. Against a base that large, a measured 1.9% is already a meaningful footprint.
DX's Q1 2026 research found that approximately 30% of merged code is now AI-authored across the developer population. This figure is self-reported and comes from asking developers directly how much of their merged code they believe is written by AI.
The two findings are not in conflict: a high share of new code can be AI-written while AI's share of everything already running remains small. Our number is also conservative, since we currently detect AI-generated code in three common enterprise languages, so the real share could be higher.
What the 1.9% confirms is that AI-generated code has moved beyond experimentation in enterprise environments. As today's high share of AI-authored new code accumulates in production, we expect that footprint to keep growing.
Is AI-generated code less maintainable than human-written code?
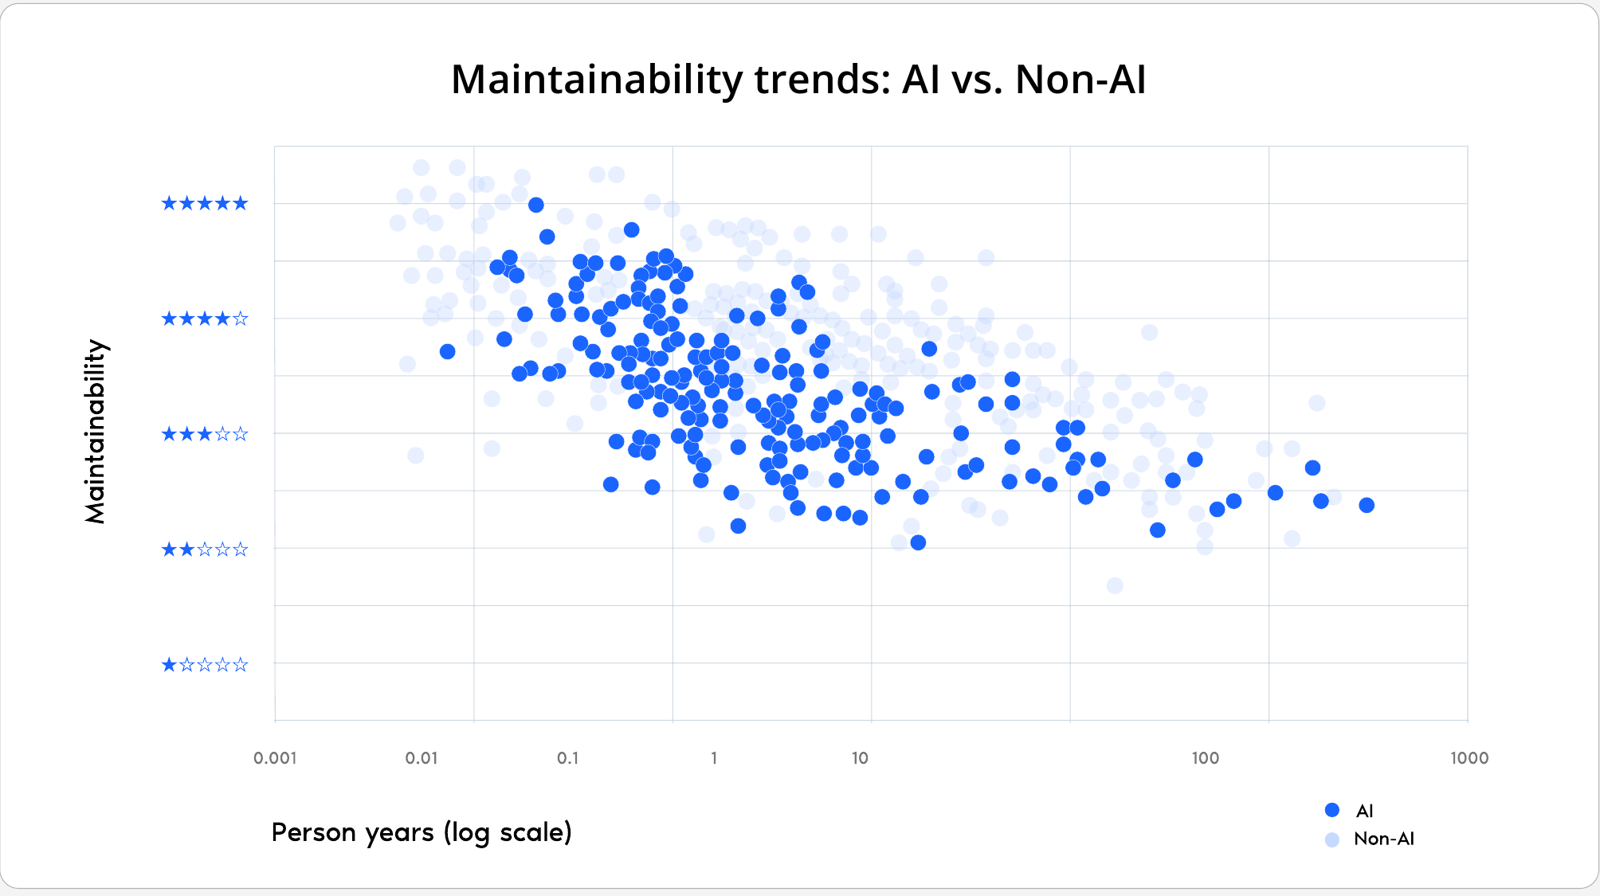
Yes. In SIG's Q1 2026 benchmark data for Java, one of the most widely used technologies in enterprise software, AI-generated code scores lower on maintainability than human-written code, and the gap widens as systems grow. AI-generated code can achieve a good maintainability score, but that becomes rarer as the lines of code, and the size of the system, increase.
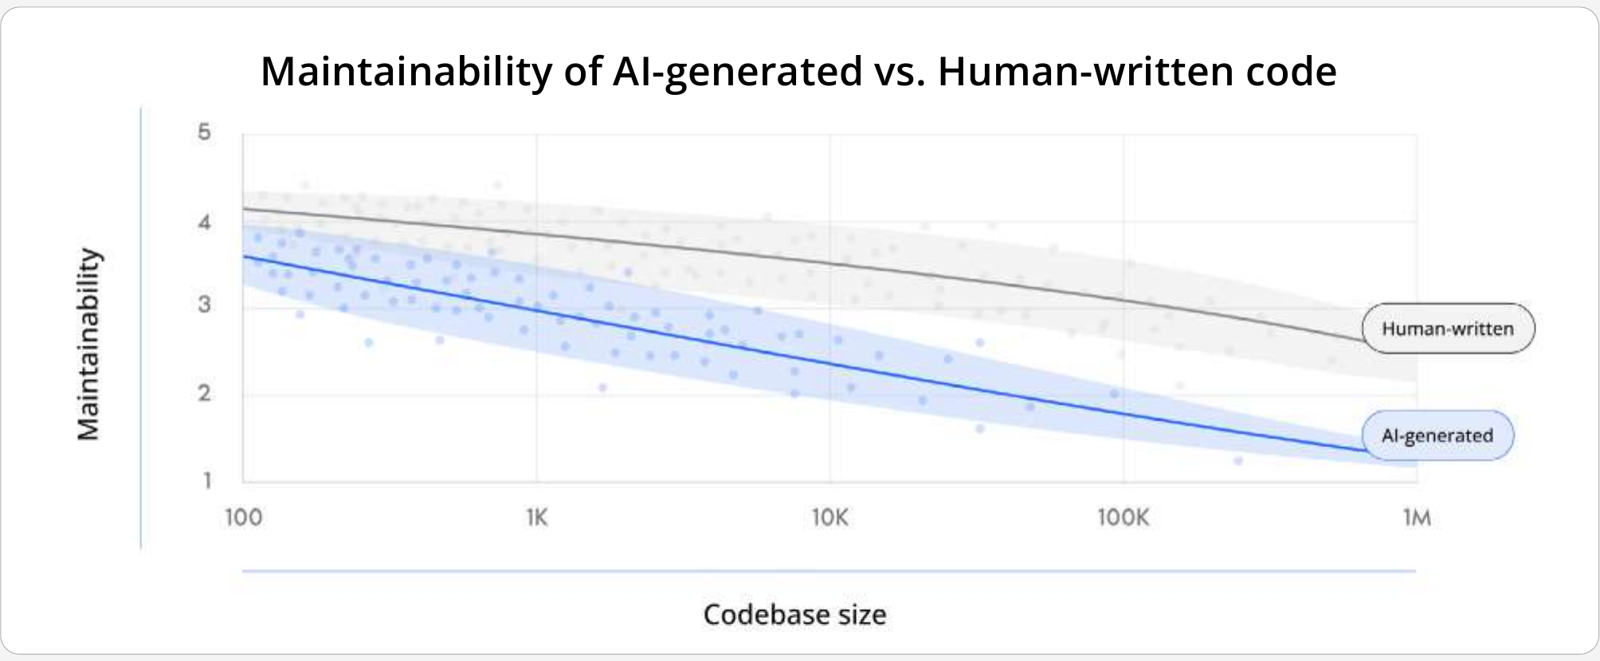
Maintainability is measured with SIG's ISO/IEC 25010-based five-star model in Sigrid, against SIG's benchmark of more than 30,000 systems. This comparison is based on a large dataset of Java systems analyzed in Q1 2026. AI-generated code is identified using SIG's detection capability, currently available for three common enterprise languages, so the figures reflect detected AI-authored code and likely understate its true share. Maintainability measures how easily a system can be changed and is one dimension of overall software quality.
Why does maintainability matter?
Maintainability is how effectively and efficiently a system can be modified, corrected, or adapted to change. It is also often referred to as "build quality." As chapter 3 will explore in more detail, a high maintainability rating lowers cost, speeds delivery, and improves security.
This raises an obvious question: if AI can write and rewrite code, why invest in maintainability at all? Because AI works best in code that is already well-structured. AI assistants and agents rely on clear structure and context to make good suggestions, and that is exactly what poorly maintained code lacks.
System scale and architectural context
AI coding assistants don't "see" your whole landscape and don't comprehend your architecture. As systems span more components and business rules, AI suggestions lose context. A recent large-scale Stanford University analysis shows the pattern clearly: AI productivity gains shrink as codebases grow. At around 10,000 lines of code, development teams saw a roughly 60% lift in productivity. By around 100,000 lines, those gains collapsed.
The bigger the system, the more those gains hinge on the one thing AI cannot see: your architecture. In addition, AI models lack domain knowledge and work within a limited context window. Simply feeding it more context does not always help. There is a technical ceiling where the model becomes less effective at identifying and using all the information you provide.
As AI-generated codebases grow, so do their issues. In some instances, fixing these issues takes up developer time that AI was supposed to save, and allowing the assistant to address its own problems can lead to new ones.
Is AI-generated code less secure?
In a 2026 SIG experiment with 16 projects, AI-generated code showed twice the security risk violations of human-written code.
AI can repeat weak patterns from public code or invent dependencies, and without explicit safeguards, key protections get missed. Peer-reviewed research published in 2025 found that more than 50% of AI-generated code contains security vulnerabilities. Our own 2026 experiment echoed this: AI-generated code showed double the security risk violations of the human-written projects.
This experiment was based on 16 projects that were generated from enterprise architecture descriptions expressed in ArchiMate. The results were used for comparative analysis between human output and four popular LLMs. The 16 projects used in this experiment are limited and may not represent diverse architectural patterns. At Software Improvement Group, we evaluate security findings through a thorough analysis of the source code. These findings are then mapped to the OWASP Top 10, which identifies the ten most critical risks in web application security.
What about agentic AI?
AI agent adoption is accelerating faster than most organizations realize. KPMG's Q4 2025 AI Pulse Survey found that 54% of organizations are now actively deploying AI agents across core operations, up from just 11% two years ago and 33% in mid-2024. That is nearly a fivefold increase in production deployment in just two years.
Gartner® predicts at least 15% of day-to-day work decisions will be made autonomously through agentic AI by 2028, up from 0% in 2024. In addition, 33% of enterprise software applications will include agentic AI by 2028, up from less than 1% in 2024.
In March 2026, we used Sigrid®, our software portfolio governance platform, to analyze three systems built with AI in different ways. We focused on maintainability and architecture, using the same ISO 25010-based 1 to 5 star model we apply across more than 30,000 systems in our benchmark.
In plain terms, we asked two questions:
- Maintainability: How easy will it be to make changes to this system over time? (More on this in chapter 3.)
- Architecture: How well is the system structured, both for seeing how the parts fit together and for changing, scaling, or replacing them later? (More on this in chapter 5.)
| AI-built system | Maintainability score | Architecture score |
|---|---|---|
| FastRender (AI agents only) | 1.1 / 5 | 2.2 / 5 |
| Claude's C Compiler (autonomous LLM team) | 1.9 / 5 | 2.4 / 5 |
| OpenClaw (human in the loop) | 3.1 / 5 | 4.4 / 5 |
About this analysis: Scores come from SIG's study of three AI-built systems, published in "Agentic AI works best with a human in the loop" (SIG, March 2026). Maintainability and architecture were rated with SIG maintainability and architecture models in the Sigrid platform. Each system was assessed on its public repository as it stood at the time of analysis. Correctness, performance, and security were not independently verified. The three systems are visible reference points rather than a representative market sample, and the scores are a point-in-time snapshot of codebases that continue to evolve.
The AI-only systems (FastRender, Claude's C Compiler) scored in what we'd normally consider legacy-like territory on maintainability, with weak architecture.
However, human-in-the-loop development (OpenClaw) landed much closer to what we'd expect from a system that can evolve better over time.
From prompt to harness engineering
Prompt or context engineering are still important but no longer enough. A new term has emerged to describe what governing agents requires: harness engineering.
| Prompt engineering | Context engineering | Harness engineering |
|---|---|---|
| Optimizes individual interactions: phrasing, structure, and examples within a single exchange. It improves the quality of what you ask the model in one turn. | Manages what the model sees: retrieval, compression, and context window management. It controls the information the model reasons over at any given moment. | Designs the entire world the agent operates in: tools, knowledge sources, validation logic, architectural constraints, feedback loops, memory, and lifecycle management. |
Harness engineering is the discipline that closes the gap between deploying agents and governing what they produce.
In simple terms, harness engineering is the practice of designing the full environment that an AI agent operates within: the rules it follows, the checks it must pass, and the feedback loops that prevent the same mistake from recurring.
AI tokenomics
As AI coding tools become standard, a new line item is appearing on monthly reports and budget sheets: token consumption. Most organizations are tracking it. Few are managing it against what it actually produces.
What are tokens?
Tokens are the units AI models process during inference. Providers charge separately for input tokens (what you send), output tokens (what the model generates), and cached tokens (context the model reuses), measured per million tokens and varying widely by provider and model.
Prices are usually measured per 1 million tokens and differ greatly depending on the model used.
| Provider | Input, $ per 1M tokens | Cache, $ per 1M tokens | Output, $ per 1M tokens |
|---|---|---|---|
| OpenAI | $0.20–$5 | $0.02–$5 | $1.25–$30 |
| Anthropic | $1–$5 | $0.10–$0.50 | $5–$25 |
| $0.50–$2 | $0.05–$0.20 | $3–$12 |
Overview based on the GitHub Copilot model and pricing page, May 2026.
The cost of AI-assisted coding
The FinOps Foundation's 2026 State of FinOps report found that AI cost management is now the top skill teams need to develop, and that 98% of respondents actively manage AI spend, up from 31% two years earlier.
What costs add up to depends on usage, the use case, and the model. To get a ballpark estimate, Anthropic states that the average cost across enterprise deployments is currently around $13 per developer per active day, or roughly $150–$250 per developer per month.
Worth noting: as recently as early April 2026, the same estimate stood at $6 per day. However, this doesn't mean the token price doubled. The per-token prices held roughly steady. The spike comes from teams burning far more tokens per developer.
The metrics for AI coding costs are still taking shape, industry benchmarks are young, and the numbers shift from quarter to quarter, which is why we will keep tracking and reporting on them as the picture matures. The harder problem is that immature metrics make costs difficult to forecast. Leaders are being asked to budget for a line item the industry has not yet learned to measure, and that uncertainty is a risk in itself. We see similarities between AI spend and cloud spend: both are variable, usage-based, and capable of spiking without warning.
How much do AI coding tools cost per developer?
Around $13 per developer per active day, or $150–$250 a month, based on Anthropic's enterprise average. For a team of 50 developers, that is roughly €120,000 a year, the equivalent of nearly one additional developer.
When we take Anthropic's estimate and round down for simplicity, to €200 per developer per month, a team of 50 developers adds roughly €120,000 per year in token spend. At a fully loaded developer cost of €150,000 per year, that is the equivalent of nearly one additional full-time developer, on no headcount plan. With volatile, usage-based pricing, that cost grows as adoption grows.
Agentic workflows cost significantly more
For agentic workflows, the economics shift. According to Gartner, agentic models also require five to 30 times more tokens per task than mainstream large language models (LLMs). A recent research paper put the gap far wider for coding specifically, finding that agentic coding tasks consume roughly 1,000 times more tokens than code reasoning or code chat.
The reason is structural. A standard AI assistant takes a task and returns an answer. An agent reads the task, generates a response, takes an action, and re-reads everything before its next step, often pulling in other agents that re-read the same context again. It also takes on the work around the task, generating and running tests and then iterating to resolve the problems those tests surface, so a single task can run through that cycle many times. That loop, driven mostly by input and cache tokens, is what can make agentic work so expensive.
Token costs and the productivity mirage
Many organizations have started tracking token consumption as a proxy for productivity: tokens generated, lines of code per day, pull requests merged per sprint.
Identifying who consumes the most tokens in a week is straightforward. But what it tells you about the quality or impact of their work is close to nothing.
This has produced a new and costly phenomenon: tokenmaxxing. Companies including Meta, Microsoft, Salesforce, and Shopify have built dashboards or tooling to incentivize AI usage. When token spend becomes a measure of who is most "AI-native," the incentive is to generate more output, whether or not it improves the system it lands in.
The costs of unchecked token spend are already surfacing in public reporting. In April 2026, Uber's CTO said the company had burned through its entire 2026 AI coding tools budget in four months. In May 2026, Microsoft reportedly began cancelling most of its direct Claude Code licenses. And Nvidia's vice president of applied deep learning, in an interview with Axios, put it bluntly: for his team, the cost of compute now runs far beyond the cost of the employees.
So, should organizations slow down AI adoption? No. But they do need to see where AI is being used across their software, and what it is producing and costing. That visibility is harder to get than most teams expect, and it matters far more than they plan for.
Visibility of AI and shadow adoption
There are multiple ways in which AI is used in building software: from code completion while typing, to copy-paste from chatbots, to coding agents that generate or modify code, and even agents that pick up a ticket, generate code, and merge the pull request. With so many different tools, you want to know when and where AI is used across your portfolio.
It's surprisingly hard to tell which code was AI-generated. Even experienced developers find it hard to distinguish AI-generated code from human-written code and "achieve only about 47% accuracy," slightly worse than flipping a coin.
You can't control what you can't see. So, how do you evaluate the effectiveness of AI-assisted coding?
Shadow adoption is rising. According to DX's Q1 2026 report, organizations should expect that developers are using personal licenses for AI tools.
Without proper guardrails in place, engineers may inadvertently expose sensitive data to models, or accept code changes which aren't regulated by organizationally accepted system prompts and other rules.
Govern AI-generated code before it reaches production
AI coding and agentic tools will only make software development faster. The question is whether your controls can keep up.
Organizations that govern AI-generated code today, with measurable quality gates, security checks, and portfolio-level visibility and context, will be the ones that capture the productivity gains without accumulating the risk or rising costs.
Chapter 2
Technical debt
Key findings: technical debt
- Reducing code-level technical debt can save €870,000 in developer time, per system, per year
- Strong architecture reduces issue-resolution time by 30%
- Systems with lower code-level technical debt can have up to 72% stronger security compliance
There is a belief that has taken hold alongside AI adoption: AI will change the technical debt equation or remove it altogether. If the tools can generate and regenerate code on demand, the reasoning goes, debt becomes a problem of the human era that AI will eventually absorb.
The findings in this report point in a different direction. AI is itself constrained by technical debt, and it is weakest precisely where debt is growing fastest: complex software architecture.
A low-maintainability system is costly to run no matter who or what writes the code, and that cost climbs once AI is doing the writing, especially in agentic environments where change is generated faster than it can be reviewed or governed.
This chapter takes a closer look at what that means, and what it costs.
What is technical debt?
The term technical debt is far from new. It was introduced in the early 1990s by Ward Cunningham. His insight was simple: shipping low-quality code quickly is like taking out a loan. A small amount of debt is fine. You borrow from future development capacity to move faster today, and you pay it back later. The problem comes when the debt compounds, growing faster than it is repaid, until the interest consumes more capacity than the original loan ever saved.
Technical debt has expanded well beyond code quality since Cunningham coined the term. It now encompasses architecture, security, maintainability, and the accumulated weight of every decision made under time pressure that was never revisited.
The next chapters in this report each explore one dimension of that debt. This chapter brings them together to show what they cost in combination, and why AI has changed the urgency of addressing them.
Not all technical debt is a problem. Intentional debt is a reasonable business decision: a deliberate shortcut taken to ship faster, with a plan to address it. The issue is unintentional debt: debt that has accumulated without anyone noticing, without a plan to address it, and without visibility into where it sits or what it costs.
The practical consequence of that distinction is that technical debt management is not a cleanup project. It is a continuous prioritization discipline: knowing where debt sits in relation to business activity, and investing in the right places at the right time.
How much does technical debt cost?
Technical debt takes 21% to 40% of total IT spending, according to Deloitte. In SIG's benchmark, raising one system from 2 to 4 stars on maintainability frees up 5.8 FTE, about €870,000 a year.
Most organizations underestimate what technical debt actually costs. Deloitte's 2026 Global Technology Leadership Study estimates that technical debt accounts for between 21% and 40% of an organization's total IT spending. For every €100 an organization spends on IT, between €21 and €40 goes toward servicing debt rather than delivering new value.
Technical debt can be reduced by improving code quality. Code quality is best understood through the lens of maintainability: the ease with which a system can be changed, improved, or fixed. This holds true for both human developers and agents.
Maintainability isn't abstract: it can be measured, benchmarked, and improved. And doing so has clear benefits: lower costs, faster delivery, better security, and more innovation capacity. The benchmark data from SIG makes this concrete at the system level.
| Maintainability improvement | Capacity freed up | Saving per system, per year |
|---|---|---|
| 2 to 4 stars | 5.8 FTE | About €870,000 |
| 3 to 4 stars | 0.8 FTE | About €120,000 |
Poor maintainability has a direct labor cost that most organizations underestimate. SIG calculates it by measuring how much development capacity a system consumes just to stay operational, rather than to deliver new functionality. The methodology applies this FTE figure against an average developer cost of €150,000 per year to produce a concrete cost figure.
These figures reflect the direct labor cost of technical debt: the engineering time consumed by keeping a system operational rather than building new capability. The portfolio math compounds quickly. A large enterprise running 10 systems at 2-star quality carries approximately €9 million per year in unnecessary maintenance overhead. That is capacity locked into technical debt, rather than competitive advantage.
The hidden costs extend beyond engineering time. Technical debt creates high-pressure working environments. Complex, poorly documented systems are frustrating to work in. Teams that spend most of their time firefighting rather than building lose people faster. Turnover, burnout, and the cost of replacing engineers who understand critical systems are real consequences of unmanaged debt, and they rarely appear in IT budget discussions.
Three dimensions of debt cost
Technical debt does not show up as a single line item. We measure it across three dimensions: code-level technical debt (maintainability), architectural debt (architecture quality), and security posture. The figures below are the headline cost of debt in each dimension. The chapters that follow explain the mechanics and dive deeper into each dimension.
Cost: code-level debt locks up engineering capacity
The €870,000 figure above is the direct labor cost of code-level technical debt: development capacity a system consumes just to stay operational, rather than to deliver new functionality. Improving from a maintainability level that flags a risk to delivery speed and cost (2 stars) to 4 stars, above the recommended 3.5-star threshold, recovers that capacity.
Speed: architectural debt slows every change
Architectural debt is a major concern in technical debt management because it sits between system components, not inside individual files. It affects how components depend on each other, how software portfolios scale, and how quickly teams can ship changes responsibly.
Unlike code-level debt, such as duplicated logic or complex functions, architectural debt is harder to detect and more expensive to fix after the fact.
Architecture quality measures the structural conditions that drive architectural debt.
Every change to a system with poor architecture quality means navigating tightly coupled components, implicit interfaces, and undocumented dependencies.
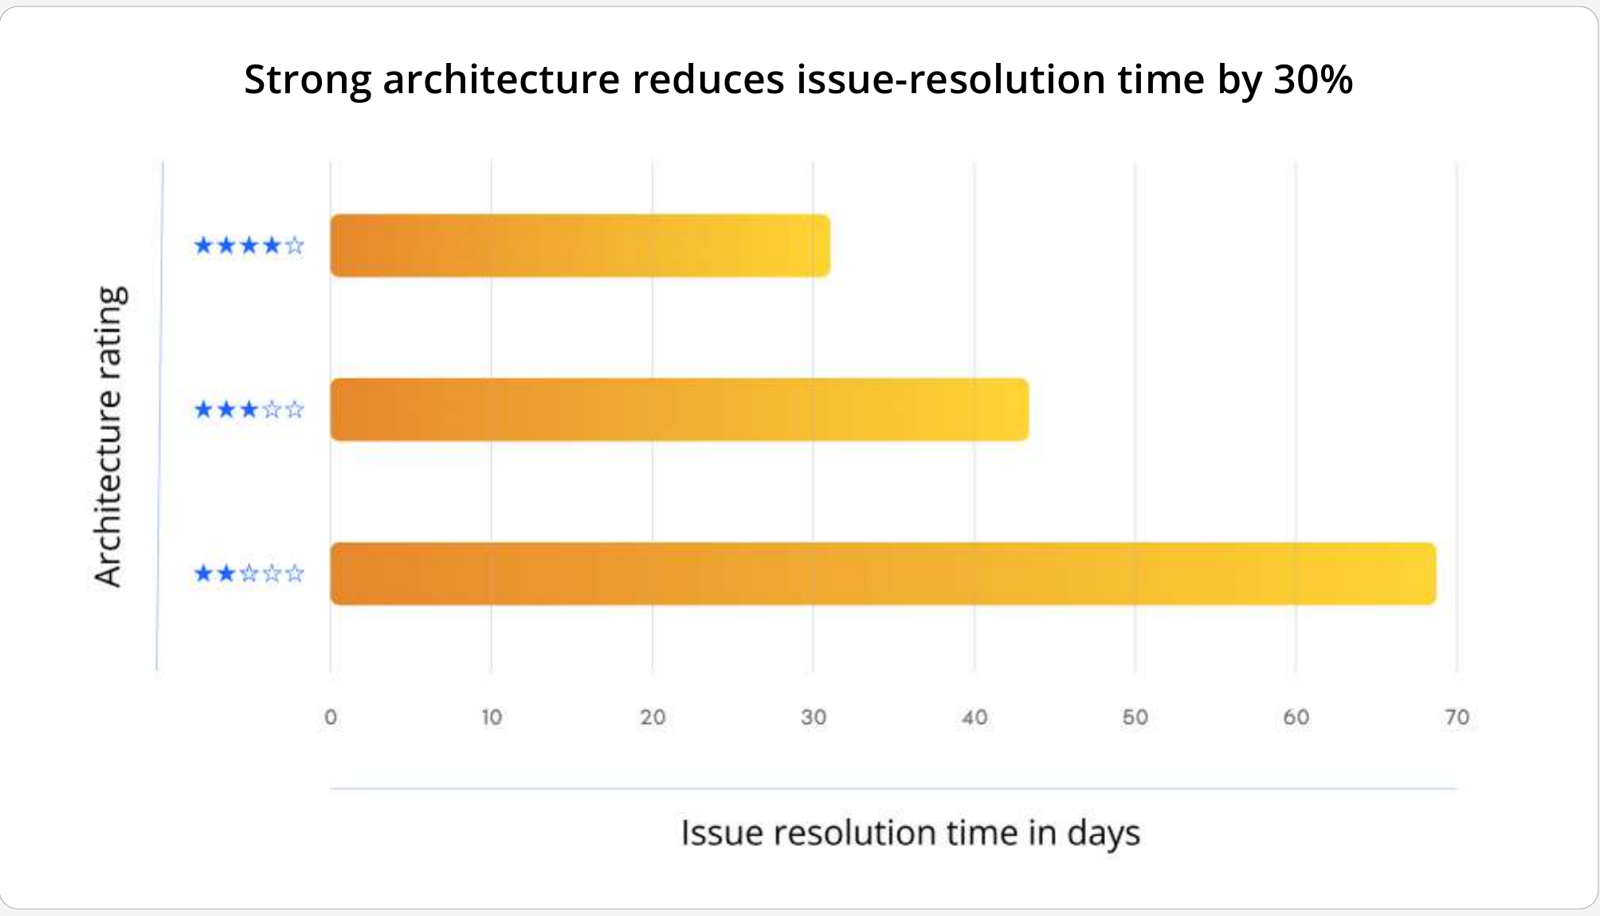
This diagram shows a correlation between architecture quality and issue-resolution time. Based on our earlier research that highlighted the efficiency gap between legacy and modern systems.
Security: low-quality code is harder to defend
SIG's data shows a consistent relationship between maintainability, the code-level dimension of technical debt, and security posture. Well-structured, low-debt code is auditable, testable, and patchable. Code carrying heavy debt is the reverse, and it leaves more room for vulnerabilities to accumulate unnoticed.
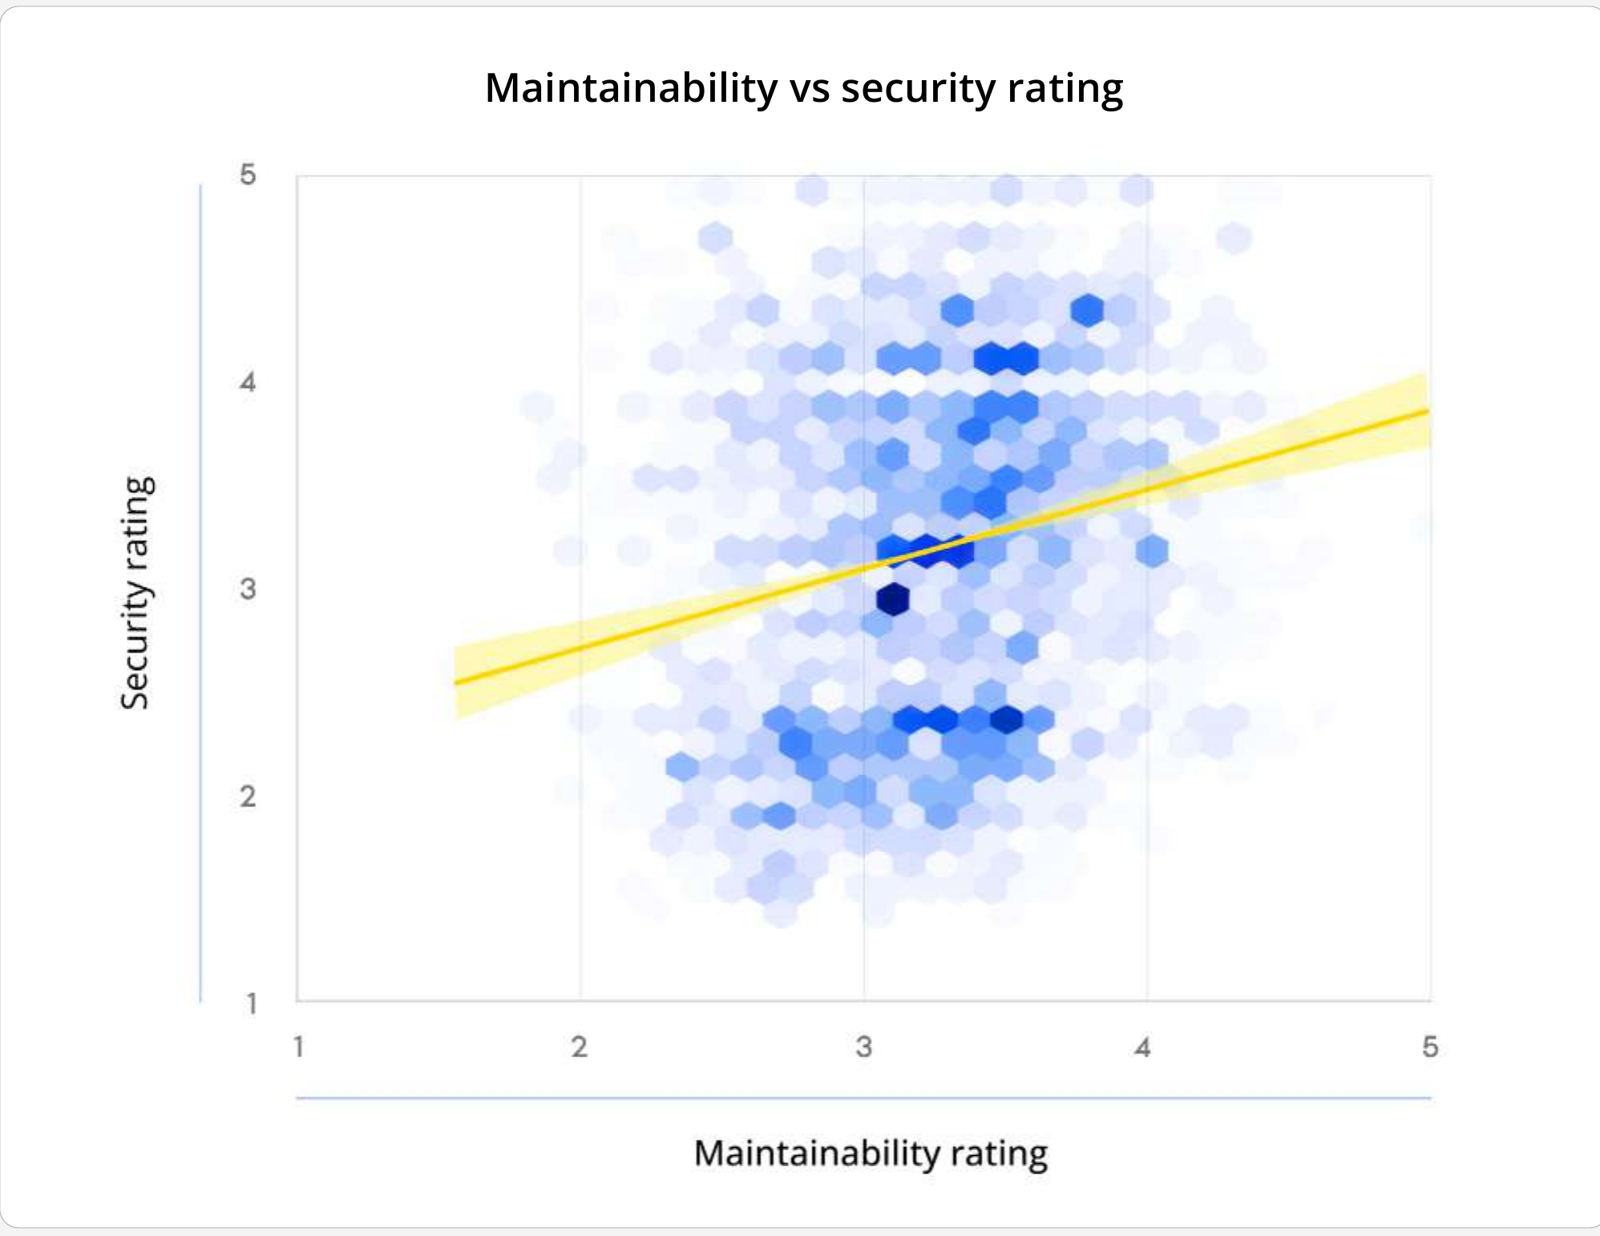
The visual shows the correlation between maintainability and security ratings. The star ratings are based on the SIG maintainability model and the SIG security model. A darker blue indicates that there are more systems in that area. Systems with a maintainability rating of 3 stars have a 36% higher security rating than systems with a 2-star rating. 4-star systems have a 72% higher security rating than systems with a 2-star rating. A 4- or 5-star security rating does not guarantee full security. It indicates that security considerations have been factored into the design and implementation, making vulnerabilities less likely.
Organizations that allow AI-generated code to accumulate without quality controls are not only accepting higher code-level technical debt. They are accepting a structurally higher security exposure.
AI is accelerating the problem, not solving it
AI coding tools are delivering real productivity gains. Individual developer productivity is up, routine tasks take less time, and code generation has accelerated meaningfully.
However, they are also making technical debt rise faster and harder to contain. The important distinction is between the types of debt AI creates and the types it can address.
Code-level debt remediation, such as duplication, complexity, and poorly structured functions, is increasingly within reach of AI tooling. Refactoring, documentation, and cleanup tasks that once required significant engineering time can now be approached with AI assistance at lower cost. That is genuinely good news, and organizations should use it.
Architectural debt is a different problem. It requires context, domain knowledge, and system-wide judgment that AI tools do not have. Architecture is not a local decision. It is the accumulated consequence of thousands of decisions made across teams, time zones, and years. An AI agent working without that context creates architectural drift, commit by commit and dependency by dependency, regardless of how capable it is at the function level.
Gartner predicts that:
- By 2027, architectural debt will account for 80% of all technical debt.
- By 2028, AI will create more technical debt on architecture levels than it solves.
Organizations that treat AI adoption and technical debt management as separate workstreams are solving the wrong version of the problem. The faster AI generates code, the faster debt accumulates, unless quality controls are built into the pipeline from the start.
Maintenance cost will also carry a token cost
The cost of keeping a system running has always been measured in developer time. The €870,000 figure earlier in this chapter is built on exactly that: the FTE capacity a system consumes to stay operational. As maintenance shifts to AI-assisted and agentic workflows, that calculation needs to change. Token consumption is now a direct, variable cost of maintaining software, and it behaves more like cloud spend than headcount. The economics of AI-assisted development are covered in chapter 1. The point for technical debt is narrower: the cost of carrying and repaying debt no longer stops at FTE time.
This changes how a common objection holds up. When a system carries heavy technical debt, the argument increasingly runs: if AI generated the code, AI can simply regenerate a cleaner version, so the debt is disposable. AI is treated as free, and rework as trivial.
Our March 2026 FastRender analysis shows why that reasoning breaks down. Cursor's swarm of AI agents built a working browser engine, over 3 million lines of code, in a single week. It was estimated that between 10 and 20 trillion tokens were consumed and, based on then-current list prices for frontier models, would have cost several million dollars.
When SIG ran the output through Sigrid, it scored 1.1 out of 5 for maintainability and 2.2 out of 5 for architecture. Tokens were spent at the scale of a large engineering organization, and the result still carried severe architectural and maintainability debt.
Architecture is a context problem, and more tokens do not solve it. Agents work within a limited context window and cannot hold a large codebase in view all at once, so past a certain size, feeding in more does not help. The extra tokens do not buy architectural understanding; they produce more code that ignores it. Each regeneration consumes tokens again, at a cost that climbs with the size and complexity of the system, and arrives at the same architectural limit. Rework with AI is not free. As systems grow, it gets more expensive, not less.
Code-level debt is increasingly cheap to address with AI. Architectural debt is not, and it is what is growing fastest. Counting tokens as a line in the maintenance budget is becoming as necessary as counting the FTEs that debt already locks up.
What good technical debt management looks like
The goal of technical debt management is not a zero-debt system. A perfect rating across every system in a portfolio is gold-plating: expensive, unnecessary, and in most cases counterproductive. The goal is knowing where debt sits, understanding what it costs in the context of business activity, and addressing it where it is actually getting in the way.
That requires three things: visibility, prioritization, and continuity.
Visibility first
Most organizations cannot accurately describe how much technical debt they carry or where it is concentrated. They know the systems that cause the most pain. They do not always know why those systems are painful, which parts are most fragile, or how the debt has changed over the past six months.
Visibility is the prerequisite for everything else. Without a clear, continuously updated picture of where debt sits, at the code level, the architecture level, and across the portfolio, prioritization is guesswork, and remediation is reactive.
Prioritize by business activity
Not all debt deserves the same attention. A stable system that changes rarely and is approaching end of life can carry debt that would be unacceptable in a system at the center of active development. The analysis that matters is where debt sits relative to business activity: which systems change frequently, which are business-critical, and where structural fragility creates delivery or security risk.
The highest-priority systems are those where those answers overlap: high change frequency, business-critical, and structurally fragile. Addressing those first delivers the fastest return and removes the constraints that matter most.
Continuous management
A remediation project launched after years of accumulated debt is necessary in some cases. But it does not solve the underlying problem. Debt will return if the conditions that created it remain unchanged.
The organizations that manage technical debt well treat it the way they treat security posture or build pipeline health: as something monitored continuously, with feedback delivered to developers or agents before debt reaches production rather than six months later during an audit.
The investment case
The financial case for systematic debt remediation is no longer theoretical. A peer-reviewed study published in April 2026 found that systematic remediation of architectural debt yields median returns of 437% over 24 months, with a break-even period of just 6.2 months. This is consistent with what SIG observes across its client base: architectural improvement is one of the highest-return investments an IT organization can make.
The urgency has increased. In an environment where AI tools are generating code at volumes that were previously impossible, and where the debt created by that code is predominantly architectural, the organizations that invest in continuous visibility and management now will be the ones whose AI programs compound in value rather than in risk.
Software Improvement Group is named a Leader in the 2026 Gartner® Magic Quadrant™ for Technical Debt Management Tools
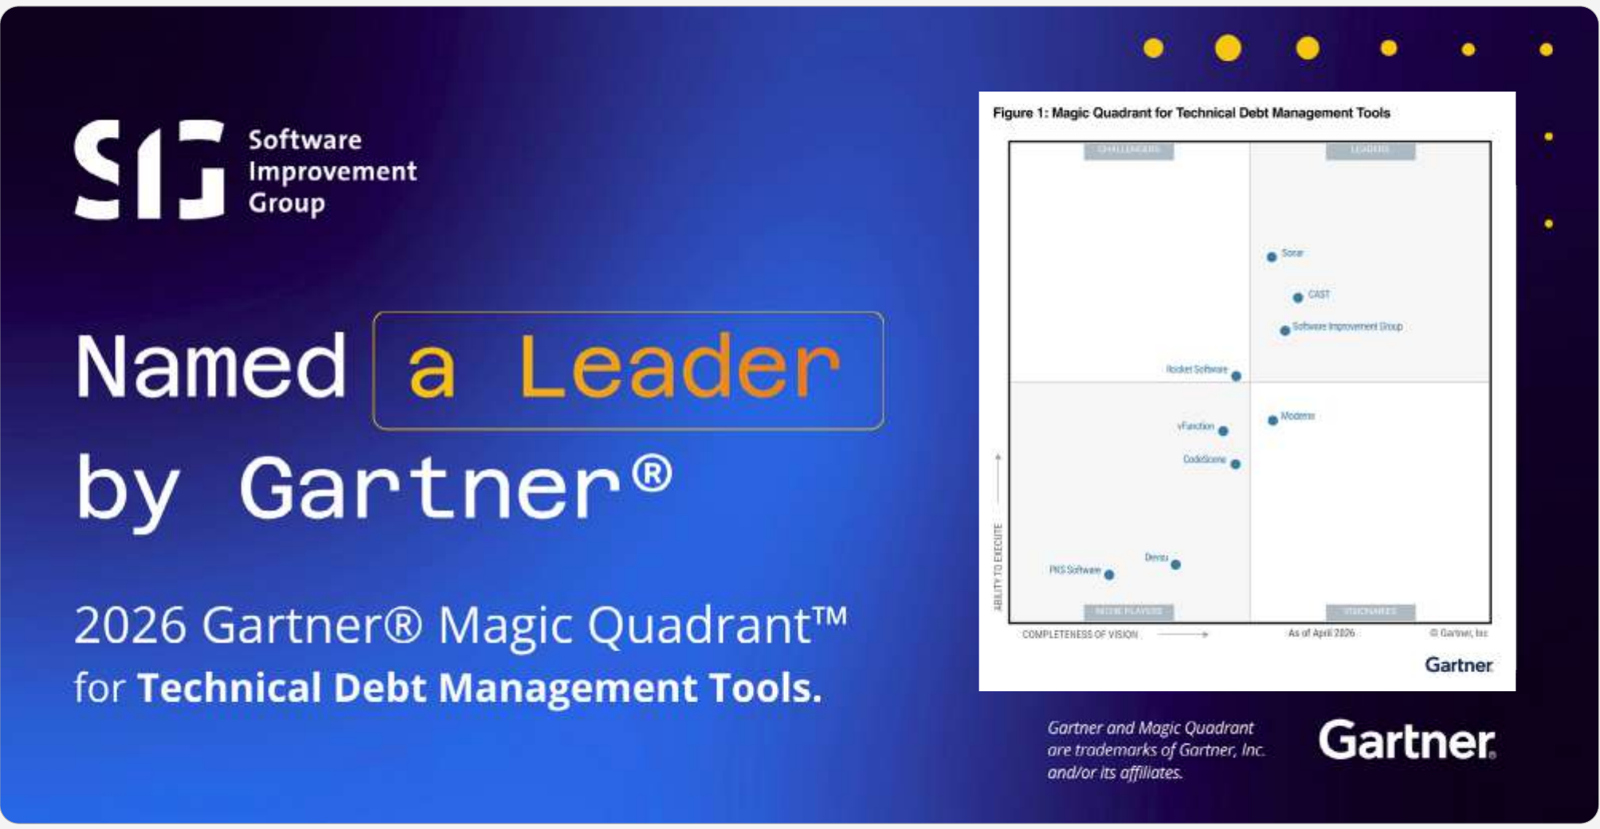
This graphic was published by Gartner, Inc. as part of a larger research document and should be evaluated in the context of the entire document. The Gartner document is available upon request from SOFTWARE IMPROVEMENT GROUP BV.
Gartner does not endorse any company, vendor, product or service depicted in its publications, and does not advise technology users to select only those vendors with the highest ratings or other designation. Gartner publications consist of the opinions of Gartner's business and technology insights organization and should not be construed as statements of fact. Gartner disclaims all warranties, expressed or implied, with respect to this publication, including any warranties of merchantability or fitness for a particular purpose. Gartner and Magic Quadrant are trademarks of Gartner, Inc., and/or its affiliates.
Gartner, Market Guide for Technical Debt Management Tools, By Tigran Egiazarov et al., 13 April 2026.
Gartner, Magic Quadrant for Technical Debt Management Tools, By Tigran Egiazarov et al., 20 May 2026.
Manage technical debt before it manages you
Technical debt management has evolved from a niche engineering concern into a strategic business priority. Sigrid® gives you portfolio-level visibility into where debt sits, what it costs, and where addressing it delivers the highest return, continuously, not just at audit time.
Set objectives based on business metrics. Track improvement sprint by sprint. Give your AI tools a foundation that works.
Chapter 3
Maintainability
Key findings: maintainability
- 86% of code falls below our recommended maintainability rating
- Industries with the most room to improve: startups and scale-ups, pharmaceutical, and telecommunications
- On average, organizations use 3 to 4 primary technologies in their stack, adding complexity and increasing talent management needs
Maintainability: the most overlooked lever in your IT budget
CIOs face a familiar pressure in 2026: cut costs while accelerating AI adoption. Most are losing the first half of that equation. Research published by McKinsey in March 2026 found that most organizations direct most of their technology budget to keeping systems running rather than building new capabilities.
But one of the most overlooked levers for cost control, productivity, and innovation? Maintainability.
What is maintainability?
Maintainability is the ease with which a system can be changed, improved, or fixed. Just like a well-built house is easier to renovate, a well-structured codebase supports safe, efficient development over time.
At Software Improvement Group, we measure maintainability using a 1–5 star model grounded in source-code facts and validated across industries. The model uses a TÜViT-certified dataset representing the global market, so scores are comparable and audit-ready.
A high maintainability rating has been proven to lower risk and cost, speed up delivery, make your systems more secure, and increase innovation capacity.
Based on these benefits, you would probably assume maintainability is a high priority for many organizations.
However, reality paints a different picture.
Maintainability score across industries
The maintainability model uses a TÜViT-certified dataset that represents the global industry. It employs a 1 to 5 star rating system with the following weight assignments: 5%, 30%, 30%, 30%, and 5%. The figure is based on code in our systems that was analyzed at least once in 2025.
Maintainability scores predict how much of a development team's time goes toward keeping existing systems working versus building something new. Systems below the threshold lock in engineering capacity that organizations need elsewhere. At a time when most senior leaders are trying to scale AI, that locked capacity is the hidden cost.
Industries with the most room to improve
Maintainability challenges are not evenly distributed; these industries are ranked based on the percentage of systems per industry that fall below our recommended maintainability score of 3.5 stars.
- Startups and scale-ups78.6%
- Pharmaceutical78.6%
- Telecommunications75%
- Services (business)69.9%
- Energy66.8%
The industries above have the most room to improve on maintainability: across SIG's benchmark, they carry the largest share of systems scoring below the recommended 3.5-star level. This ranking is based on SIG's maintainability model. Only industries represented by at least 100 systems are included. Within that group, industries are ordered by the share of systems scoring below SIG's recommended maintainability level of 3.5 stars. The results describe the systems in SIG's benchmark, not an assessment of any individual organization or of an entire industry.
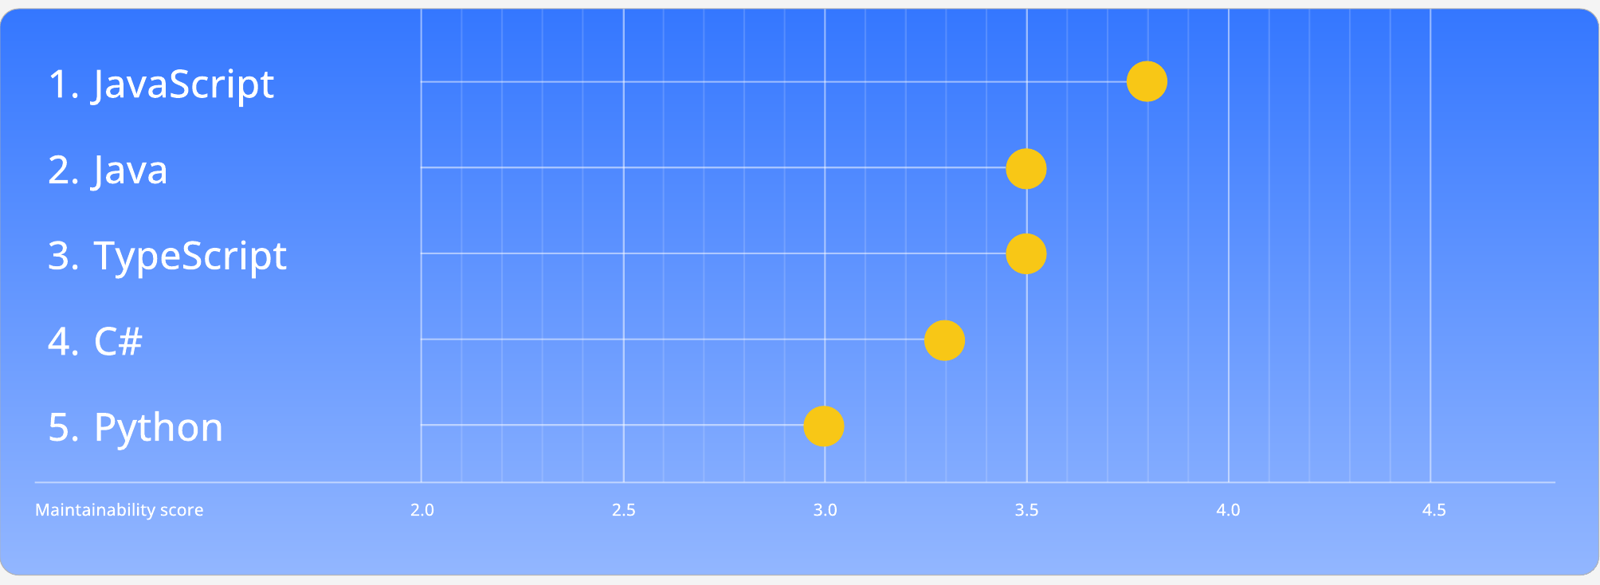
Technology matters: what is in your stack?
Maintainability scores vary by technology. Not all programming languages are equal when it comes to maintainability. We looked at some of the most used technologies in enterprise organizations.
The stack is deeper than you think
The average portfolio in SIG's benchmark uses 3 to 4 core technologies. The largest number observed: 45 technologies in a single portfolio.
Core technology refers to the language with the highest volume in a system. For example, if a system is 60% Java, 5% SQL, and 5% TypeScript, it counts as a Java system.
But the reality is more complex; most systems also include several secondary technologies under the hood. This matters because:
- Every component needs to be maintained and secured, requiring additional effort and expertise.
- Knowledge silos grow when only a few people understand certain layers.
- A fragmented stack increases risk and cost.
Maintainability is measurable. So is the cost of ignoring it.
86% of code falls below our recommended maintainability rating. For many organizations, that translates to millions in locked engineering capacity every year; capacity that could be building new products, shipping faster, or adopting AI tools successfully.
Sigrid® measures maintainability across your entire software portfolio, giving you a fact-based, TÜViT-certified view of where engineering capacity is being lost and where improvement delivers the highest return. Set targets, track progress, and prioritize with confidence.
Chapter 4
Security
Key findings: security
- 71% of code has a low degree of security controls
- The average-sized system contains 20 critical security findings
- 45% of systems score below our recommended open-source health rating
- On average, enterprise organizations rely on 132 open-source libraries
- Security risk scales with system size: large systems average 2.8 stars, medium 3.3 stars, small 3.5 stars
The need for a holistic cybersecurity approach
There was a time when cybersecurity felt like a problem you could solve easily. Patch the known vulnerabilities, perform a penetration test, buy the right tools, check the compliance boxes.
That changed, and recent developments have made that undeniable.
The scale of what is happening in software security has shifted in two directions simultaneously.
On one hand, AI-powered defenses are working. IBM's 2025 Cost of a Data Breach Report found that the global average breach cost fell to $4.44 million, the first decline in five years. IBM attributes the drop to faster detection and containment, driven by broader investment in AI-powered tooling. Organizations using AI and automation extensively in their security operations saved an average of $1.9 million per breach compared to those that did not.
Claude Mythos and the AI security threat
On the other hand, the same technology is accelerating risks. On April 7, 2026, Anthropic announced an AI model, Claude Mythos Preview, capable of autonomously discovering, through source code analysis, thousands of previously unknown software vulnerabilities; flaws that had survived decades of human review.
As we explore in this more detailed breakdown, this is the central challenge: the same capabilities that help defenders move faster are available to attackers too, and the gap between what organizations can discover and what they can control is growing.
This is the environment SIG is measuring against in 2026. And what our portfolio data continues to show is that the organizations weathering this environment best are not the ones with the most sophisticated security tooling. They are the ones with the clearest picture of what they are running, the strongest software foundations, and the discipline to treat security as a continuous practice rather than a periodic checkpoint.
Layers of defense: why one method is never enough
Most organizations understand, in principle, that security requires multiple layers.
- Penetration testing: Finds what attackers would find.
- Static Application Security Testing (SAST): Analyzes the source code to detect weaknesses before deployment.
- Software Composition Analysis (SCA): Scans third-party open-source libraries and dependencies for known vulnerabilities.
- Dynamic Application Security Testing (DAST): Automatically scans your live system for weaknesses.
Each method covers ground the others miss. So, no single method is enough on its own. SAST, DAST, and SCA are complemented by penetration testing to form a complete security assessment. Together, these techniques enable earlier detection, stronger compliance, and more secure software from the start.
The reality is that many developers continue to release code that lacks proper input sanitization and access control. The OWASP Top 10, the industry's standard reference for critical web application risks, has seen broken access control and injection flaws at the top of the list for years. Attackers know this pattern as well, and they exploit it systematically.
How secure is enterprise code?
71% of code in SIG's benchmark has a low degree of security controls.
The star ratings in this report are produced by Sigrid's SAST (Static Application Security Testing) security model, which ranks software systems from 1 to 5 stars. Sigrid evaluates system properties through automated static analysis of the source code and infrastructure, deriving scores for various security characteristics. These scores are then mapped to the OWASP Top 10, the ten most critical risks in web application security. The star rating reflects a system's compliance against that benchmark: 1. severely low degree of security controls, 2. very low degree of security controls, 3. low degree of security controls, 4. moderate degree of security controls, 5. high degree of security controls. A 4- or 5-star rating does not guarantee full security. It indicates that security considerations have been factored into the design and implementation, making vulnerabilities less likely. The figure is based on code in our systems that was analyzed at least once in 2025.
Larger systems tend to score lower on security
Large systems are more complex: built over longer periods, by more teams, with more accumulated decisions. What matters is which systems those are.
Large systems are the ones most likely to be business-critical. They often process the most sensitive data. They represent the most valuable targets. And they have the weakest security posture of anything in the portfolio.
Large systems accumulate security debt for a straightforward reason: security gets treated as something to address once a system is built, rather than designed in from the start. Technical debt compounds over time, vulnerabilities accumulate, and institutional knowledge walks out the door as teams change. By the time a system reaches the scale where it genuinely matters to attackers, fixing its security posture means unwinding years of decisions made under entirely different priorities.
Security by design is not an aspirational principle. At the scale and speed the threat landscape is now operating, it is the only approach that works.
The scale of security findings
Based on our data, we could calculate an estimate of security findings in an average system. We found that it's not uncommon for an average-sized software system to have 20 critical security findings.
Not every security flaw turns into a breach, but with the average breach globally costing $4.44 million, why take the risk? Catching vulnerabilities early in the development process can help organizations avoid costly breaches, business disruption, and reputational harm.
Most detected OWASP Top 10 findings
| OWASP category | Share of findings | What it means |
|---|---|---|
| A1 Broken access control | 31.5% | Access control enforces policy such that users cannot act outside of their intended permissions. Failures typically lead to unauthorized information disclosure, modification or destruction of all data, or performing a business function outside the user's limits. |
| A3 Injection | 23.4% | An injection vulnerability is an application flaw that allows untrusted user input to be sent to an interpreter (e.g. a browser, database, the command line) and causes the interpreter to execute parts of that input as commands. |
| A4 Insecure design | 23.1% | Insecure design is a broad category representing different weaknesses, expressed as "missing or ineffective control design." |
| A9 Security logging and monitoring failures | 8.3% | Without logging and monitoring, attacks and breaches cannot be detected, and without alerting it is very difficult to respond quickly and effectively during a security incident. |
| A5 Security misconfiguration | 4.8% | Security misconfiguration is when a system, application, or cloud service is set up incorrectly from a security perspective, creating vulnerabilities. |
Industries with the most room to improve
Security challenges are not evenly distributed. These industries are ranked based on the percentage of systems per industry that fall below our recommended security score of 3.5 stars.
- Services63.5%
- Financial services (FSI)53.3%
- Public46.2%
- Manufacturing45.6%
- Software43.6%
This ranking is based on SIG's security model. Only industries represented by at least 100 systems are included. Within that group, industries are ordered by the percentage of systems scoring below 3.5 stars. The results describe the systems in SIG's benchmark, not an assessment of any individual organization or of an entire industry.
The AI security blind spot
Chapter 1 of this report shows that AI-generated code produces double the security violations of human-written code. If you cannot tell which parts of your codebase were written by AI, you cannot prioritize them for review, you cannot apply additional controls to them, and you cannot measure whether your risk is growing as AI-assisted development accelerates.
The governance gap runs deeper than code. IBM's 2025 Cost of a Data Breach Report found that 97% of AI-related breaches occurred in organizations without proper AI access controls, and that 63% lacked AI governance policies entirely. Shadow AI, employees reaching for consumer AI tools that IT has not approved, often for entirely understandable reasons of convenience, appeared in 20% of all breaches studied, adding an average of $670,000 to the cost of each incident. A Gartner survey of 302 cybersecurity leaders conducted March to May 2025 found that 69% of organizations suspect or have evidence that employees are using prohibited public GenAI.
The open-source dilemma
Open-source software (OSS) is source code developed and maintained through open collaboration.
Anyone can use, examine, alter, and redistribute OSS as they see fit, typically at no cost. Understandably, it is and has been very popular: 96% of organizations were increasing or at least maintaining their use of open-source software in 2025. Our data shows that the average enterprise organization relies on 132 open-source libraries.
SIG's Open Source Health quality model rates the risk a system carries from its third-party open-source dependencies, benchmarked on a 1-to-5 star scale across five areas: vulnerabilities, dependency freshness, license risk, community activity, and dependency management. This figure shows the share of systems in SIG's benchmark scoring below SIG's recommended open-source health rating of 3.5 stars.
That means nearly half of all systems carry significant open-source risk that their teams may not have a clear view of.
The exposure this creates has become more tangible in 2026.
AI-powered vulnerability scanning targets publicly visible code, open-source components, and publicly available binaries far more effectively than proprietary code that has no public presence.
The practical implication is that the open-source dependencies in a system are, right now, the most likely vector for an AI-assisted attack.
Recent supply chain attack examples
IBM's 2026 X-Force Threat Intelligence Index tracked a nearly fourfold increase in large-scale supply chain and third-party compromises since 2020. Below are a few recent examples.
Axios
The Axios attack on March 31, 2026 illustrated what this looks like when exploitation happens fast. A widely used JavaScript library with over 100 million weekly downloads was compromised. The poisoned version was live for three hours. First confirmed infections arrived 89 seconds after publication. The organizations that contained their exposure quickly were the ones that already knew exactly which systems depended on which version of that library.
LiteLLM
In March 2026, a threat group called TeamPCP compromised Trivy, a widely trusted security scanner, and used it to create a backdoor into LiteLLM, an AI gateway installed across millions of developer environments. The attackers did not break into a product or steal customer data directly. They compromised Trivy, a widely used open-source security scanner maintained by Aqua Security. Once inside Trivy, they could reach everything that used Trivy to check its own code. That included LiteLLM, an AI gateway widely embedded across cloud environments, whose breach exposed credentials across tens of thousands of developer systems worldwide.
Shai-Hulud
The first Shai-Hulud wave surfaced in September 2025. It was a self-replicating worm that compromised more than 500 npm packages, scanning infected environments for developer credentials, GitHub tokens, and cloud API keys before republishing itself across the registry. Researchers called it a turning point that marked a significant evolution in supply chain threats.
But between November 22 and 23 of 2025, a new wave began and was aptly dubbed "the second coming." Shai-Hulud 2.0 slipped into widely used open-source components and tried to copy itself, steal access keys, and in some cases even attempt file wipes. Reporting by Cybersecurity News indicates it has compromised nearly 1,200 organizations, including major banks, government bodies, and Fortune 500 technology firms.
Detect vulnerabilities before they are exploited and manage your open-source risks in one place
AI-generated code, shadow AI, and unmonitored open-source dependencies are expanding attack surfaces faster than most organizations can track them. The organizations that contain their exposure fastest are the ones that have visibility into their software systems.
Sigrid's Software Security capability continuously scans your portfolio to uncover vulnerabilities in source code, ranks risks by severity and business impact, and provides AI-powered mitigation advice aligned to OWASP, ISO, and CWE standards.
Sigrid's Open Source Health capability evaluates every open-source library across known vulnerabilities, freshness, activity, stability, management, and legal licenses, giving you a benchmark-based view of your dependency risk across the entire portfolio.
Chapter 5
Architecture
Key findings: architecture
- 50% of code is below our recommended architecture quality score
- Architecture quality varies by technology stack: Java, C#, TypeScript, and Python cluster between 3.5 and 4.1 stars
Legacy systems block agility
Legacy systems are still the backbone of many organizations, but they've become a major barrier to change. In fact, legacy infrastructure has ranked among the top barriers to successful digital initiatives for three consecutive years, according to Deloitte's 2025 annual Tech Value survey.
According to McKinsey, more than 70% of software used by Fortune 500 companies was developed over 20 years ago. While a lot of these systems may still technically "work," they were never built for today's fast-moving, digital-first world, let alone an AI-driven one.
Legacy systems now carry two compounding liabilities.
The first is architectural: systems built on outdated technology are structurally harder to change, integrate, and extend.
The second is strategic: nearly 60% of AI leaders identify legacy system integration as the primary barrier to deploying agentic AI. Connecting AI to fragile, poorly documented codebases slows delivery and introduces security exposure that legacy systems were never designed to manage.
What is software architecture?
Software architecture is the structural design of a software system and refers to the way a given codebase is divided and grouped together based on responsibilities of the system, and the underlying dependencies between these responsibilities.
What is legacy technology?
Legacy technology refers to software code that still serves its purpose but was developed using now outdated technologies. It encompasses code inherited from another team or an older software version and source code no longer actively supported or maintained.
What's the connection between legacy systems and architecture?
Legacy systems tend to accumulate the exact characteristics that define weak architecture: poor maintainability, tight coupling, low component independence, and high duplication. Legacy architectures are inherently risky because they're hard to change, prone to unreliability, and slow to adapt.
The older and more outdated a system's technology foundation, the harder it becomes to change, integrate, and scale. In 2026, that pattern collides directly with the strategic priority at the top of nearly every board agenda: artificial intelligence.
Agentic AI adoption and the need for good architecture
The rise of autonomous AI agents capable of performing complex, multi-step tasks requires a specific agent-oriented architecture. Most organizations are implementing AI programs on top of infrastructure that was never built to support them. The result shows up quickly: delayed timelines, disappointing returns, and pilots that never make it past proof of concept.
Deloitte's 2025 Emerging Technology Trends study found that only 14% of organizations have agentic AI solutions ready to deploy, and just 11% run them in production. Gartner predicts that over 40% of agentic AI projects will be canceled by the end of 2027, due to escalating costs, unclear business value, or inadequate risk controls. They state that integrating agents into legacy systems can be technically complex, often disrupting workflows and requiring costly modifications.
Legacy modernization is now a prerequisite for AI-led growth. The main constraint is lower architecture scores.
The security risk associated with legacy systems has not diminished either. Systems built on outdated technology correlate with elevated security exposure, as documented in the security chapter of this report. That risk compounds when legacy systems serve as the integration point for AI, connecting fragile codebases to models that operate with real-world consequences.
What our data shows
The SIG Architecture Quality model measures how readily a software system can evolve as business needs change. It assesses five architecture sub-characteristics: structure, communication, data access, evolution, and knowledge, each reflecting how strongly that aspect affects the speed at which foundational changes can be made. SIG scores these from nine system properties measured in the source code and version-control history: code breakdown, component coupling, component adjacency, component cohesion, communication centralization, data coupling, bounded evolution, knowledge distribution, and component freshness. The property scores are then aggregated into an overall architecture rating from 1 to 5 stars. The figure is based on code in our systems that was analyzed at least once in 2025.
Industries with the most room to improve
Architecture quality challenges are not evenly distributed. These are the five industries with the highest share of systems that score below our recommended architecture rating.
- Pharmaceutical40.9%
- Software and IT39.7%
- Logistics39.6%
- Public36.6%
- Financial services industry33.9%
This ranking is based on SIG's Architecture Quality model. Only industries represented by at least 100 systems are included. Within that group, industries are ordered by the share of systems scoring below SIG's recommended architecture rating of 3.5 stars. The results describe the systems in SIG's benchmark, not an assessment of any individual organization or of an entire industry.
Architecture quality by technology
Architecture quality also varies by programming language. SIG's benchmark data shows a clear leader and a notable cluster in the middle.
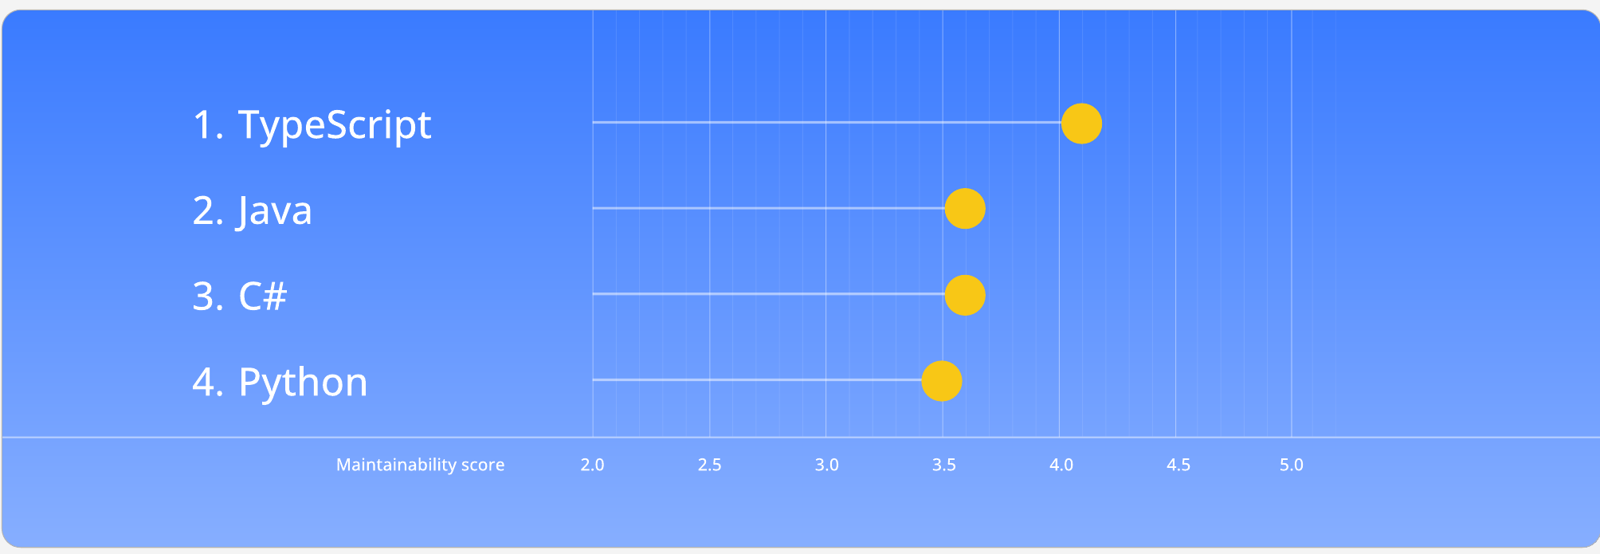
Technology choice shapes architectural potential, but it does not determine outcomes. A Java system built with disciplined modularity can outperform a JavaScript system with tangled dependencies. Architecture quality requires active management across the full lifecycle, not just the right language at the start.
See your architecture as it is
Most organizations have an idea of what their architecture should look like. Sigrid® shows you what it looks like in real time. Every component, dependency, and AI integration, including the ones you did not plan for.
Sigrid evaluates how well your architecture adapts to new requirements, identifies the components that need attention first, and tracks improvement as you modernize, within your regular development cycles, without stopping operations.
Chapter 6
AI systems engineering
Key findings: AI systems engineering
- From all the enterprise systems (in production) we analyzed in 2025, roughly 1.5% qualify as an AI system
- 72% of AI systems score below our recommended maintainability threshold
AI systems vs. traditional software
While AI-assisted coding changes how we build software, AI systems change what software is. Unlike conventional software, which follows fixed, pre-programmed rules, AI learns, evolves, and makes autonomous decisions.
According to ISO/IEC 5338, co-developed by Software Improvement Group, AI is classified as a software system with unique characteristics.
These include the ability to think autonomously, learn from data, make decisions based on that data, and even potentially talk, see, listen, and move. In addition, AI needs regular retraining to stay accurate.
What sets AI software apart from traditional software is that it doesn't just follow fixed rules. Instead, it learns by analyzing large sets of data, finding patterns, and using that knowledge to make educated guesses when making decisions, solving problems, or answering questions.
Because of its unique features, AI is often misunderstood and can carry risks, including security issues, mistrust, and potential harm. To manage these risks, AI systems need strong engineering practices and proper regulation within the organization.
AI system adoption and popular technology categories
In our database, we see that AI systems are present but not yet dominant: from all the systems (in production) we analyzed in 2025, roughly 1.5% qualify as an AI system.
SIG identifies AI systems using Sigrid's AI technology detection, which scans source code for signals of AI use such as machine learning models, large language model invocations, and AI cloud infrastructure (for example Google Vertex, Azure AI Foundry, or AWS Bedrock). A system is counted as an AI system when Sigrid detects one or more of these technologies in its code. Detection runs through more than 300 checks across Python, Java, and C#, so the figures reflect AI use in those languages and are likely to understate the true share.
This aligns with realistic adoption trends discussed earlier in this report. Many organizations are piloting; fewer have crossed into scaled, business-critical AI in production.
These figures show, per AI category, the share of the organizations we analyzed that operate at least one system in that category. Because organizations can operate multiple system types, categories may overlap.
- Traditional AI / ML: Supervised and rule-bound models that do narrow tasks well (fraud flags, predictive maintenance, recommendations).
- LLM-based applications: Systems that use large language models for classification, retrieval-augmented generation, summarization, or code and text generation recommendations.
- AI infrastructure: Systems that make use of (cloud) infrastructure for training, tuning, and hosting models.
- AI protocols: Systems that talk to LLMs or AI agents, e.g. using MCP.
- Agentic systems: Compositions of one or more AI "agents" that plan, call tools, and hand work off.
Sigrid's AI technology detection sorts AI use in the code into six categories: generative AI (invoking large language models and related technology), traditional machine learning (using or training ML models), agentic AI (technology for building autonomous AI agents), AI protocols (such as Model Context Protocol, Agent2Agent, or Agent Communication Protocol), AI infrastructure (AI cloud platforms, vector stores, and similar), and AI coding configuration and instructions (artifacts holding rules and policies for AI coding assistants, a category currently being added). Detection uses more than 300 checks across Python, Java, and C#, so the figures reflect AI use in those languages and are likely to understate the true share.
The AI system quality issue
Our benchmark data shows a clear pattern: 72% of AI systems score below our recommended maintainability threshold.
Based on a subset of 300+ AI systems compared to traditional software systems written in similar languages and of similar volume. Maintainability is measured with SIG's maintainability model in Sigrid, benchmarked across more than 30,000 systems, where 3.5 stars is the recommended level. The 72% shown is the share of AI systems scoring below that level.
The good news is that it is certainly possible to develop high-quality AI systems.
However, engineering robust, future-proof AI systems is still a relatively new field.
We see many organizations struggling to transition AI from experimental projects in the lab to scalable, secure, compliant, and maintainable real-world applications. The engineering challenges stem from how AI engineers, such as data scientists, are traditionally managed and trained.
Their focus is often on quickly creating insights and models, not on building systems that are secure, reliable, maintainable, reusable, easy to transfer, and testable. AI systems are software systems and should be treated as such.
That said, AI systems are unlike any software we've worked with before. They learn, adapt, and operate with a level of autonomy that traditional systems don't.
Building AI systems that last
The five root causes SIG sees repeatedly across AI systems in production are consistent:
- Lab programming habits that never got production-hardened.
- Data science education that prioritizes model accuracy over engineering discipline.
- Development tools designed for experimentation rather than maintainability.
- SQL-heavy pipelines that are difficult to test and transfer.
- Siloed teams where data scientists and software engineers rarely work alongside each other.
These structural patterns emerge when organizations treat AI as a special category of work rather than as software, with all the engineering rigor that implies.
The path forward is not complicated, but it does require deliberate effort across three areas.
- Maintainability and test coverage need continuous measurement, not periodic review.
- Cross-functional teams, where data scientists and software engineers work together daily, close the gap faster than any process change can.
- Treating AI within the existing software lifecycle (version control, security testing, documentation, architecture review) rather than building a parallel process around it is what allows AI to move responsibly from the lab into production.
Develop robust AI systems that won't become liabilities
Unlike conventional software, which follows fixed, pre-programmed rules, AI learns, evolves, and makes autonomous decisions. To manage AI-specific risks, AI systems need to adhere to strong engineering practices.
Build and manage AI systems that are reliable, secure, and compliant.
Where does the data come from?
The findings in State of Software 2026 come from the systems Software Improvement Group analyzed in Sigrid® over the past year. Each system is rated against SIG's benchmark of more than 30,000 systems, over 400 billion lines of code, and 300+ technologies. SIG's own figures are set against independent research, which is linked wherever it is cited.
| What we measured | How |
|---|---|
| Analysis window | Maintainability, security, architecture, and open-source health figures are based on code analyzed at least once in 2025. |
| Quality ratings | Systems are rated from 1 to 5 stars with SIG's ISO/IEC 25010-based models, against SIG's benchmark of more than 30,000 systems, the world's largest software quality benchmark. SIG's lab is TÜViT-certified. The maintainability model uses a 5%, 30%, 30%, 30%, and 5% distribution. The recommended level is 3.5 stars. |
| Security | Sigrid's static application security testing (SAST) model, with findings mapped to the OWASP Top 10. |
| AI-generated code | A machine learning classifier that uses more than 90 stylometric features and identifies AI-generated code with over 95% accuracy. It covers Java, C#, and Python, so the figures likely understate the true share. |
| AI systems | More than 300 checks across Python, Java, and C# detect machine learning models, LLM invocations, agentic frameworks, AI protocols, and AI cloud infrastructure in source code. |
| Industry rankings | The maintainability, security, and architecture rankings include only industries represented by at least 100 systems, ordered by the share of systems scoring below the recommended 3.5 stars. This minimum does not apply to the AI-generated code and AI systems analyses, whose samples are described in the notes under each chart. Rankings describe the systems in SIG's benchmark, not individual organizations or entire industries. |
| Experiments | The security comparison is based on 16 projects generated from ArchiMate architecture descriptions, comparing human output with four popular LLMs. The agentic AI comparison rated three publicly available AI-built systems in March 2026. |
How to cite this report
Software Improvement Group (2026). State of Software 2026: A global report on enterprise software and technical debt in the age of AI. https://www.softwareimprovementgroup.com/publications/state-of-software-2026/
State of Software 2026 is licensed under CC BY-NC-ND 4.0. You're welcome to quote and share the findings with attribution and a link to this page.
Written by Software Improvement Group
Software Improvement Group (SIG) empowers organizations to govern the software their business runs on. Through complete portfolio analysis, benchmarking, and strategic guidance, SIG helps companies build better software and adopt AI without losing grip on cost, speed, and risks.
Sigrid®, its software portfolio governance platform, is offered as Sigrid Core and Sigrid Axis. AI makes writing code faster than ever, and harder to trust. Sigrid Core is built on SIG's benchmark data and quality models, showing organizations whether their software is sound and what it will cost them if it isn't. Sigrid Axis builds on that same foundation as the deterministic layer for probabilistic AI and works with AI coding agents to produce code that is secure, maintainable, and true to the architectural design.
SIG operates the world's largest software quality benchmark, consisting of over 600 billion lines of code across more than 40,000 systems and 300+ technologies. It is also the world's only ISO/IEC 17025-accredited laboratory for software quality analysis, and co-developed standards such as ISO/IEC 5338, the global standard for AI lifecycle management, and prEN 18282, the forthcoming draft of the official AI Act security standard.
Founded in 2000 and headquartered in Amsterdam, SIG has offices in North America and Europe, and partnerships across the world for global support.
Combining renowned quality models with technology and over 25 years of industry-leading expertise, SIG is the global authority on continuous software portfolio governance.
For more information, please visit Software Improvement Group's website or social media channels.
Trusted by organizations including TELUS, KLM, NXP, ING, Alliander, Philips, DHL, Siemens, Konecranes, and THL.
Know where your software stands, how it compares, and where to improve. Explore our platform and services.