Software development life cycle phases: Unveiling the invisible impact of source code
In this article
In today’s competitive and ever-changing business environment, it is essential to have systems and services in place to ensure the smooth running of your operations. When done right, enterprise software can be a comprehensive system that serves the needs of an entire organization.
However, managing an enterprise software portfolio is about a lot more than relying on just functional aspects of the software, and there is a lot to consider even after a system is deployed. Besides continuous maintenance efforts and bug fixes, new features are often introduced.
What do these things have in common? They all require your development teams to either write new code or change existing code.
So as a business, how will this impact you, and when?
To help answer that question, we’ve analyzed 500 different enterprise software systems –and specifically looked at the yearly growth and change rates of code per life-cycle phase.
These unique insights can help companies like yours set clearer expectations, better track activities, and more accurately set budgets or allocate resources.

Why should you define the different phases of enterprise software?
Our 2023 Benchmark report suggests that organizations can significantly enhance their software portfolio management by explicitly defining the various stages of life through which each software system passes.
By doing so, companies can strategically manage their software portfolio, ensure that software systems are adequately supported throughout their lifespan, manage risks, and allocate resources more efficiently.
Let’s define what we mean by looking at the different stages in the enterprise software life cycle, (as we don’t want to confuse it with the similar sounding –yet different– software development lifecycle.)
Software development life cycle phases
Let’s take a look at the different life-cycle phases and describe what typically tends to happen during each phase.
Initial development phase
The Initial Development phase starts with the first code being written and typically ends when the software is considered both stable and feature-rich enough to be rolled out. In this phase, the software is typically written by one or more dedicated development teams.
In the initial development phase, the rapid growth of new code volume and many changes to the existing code are expected.

Evolution phase
After going into production, typically evolutionary activities take place: addressing feedback from users on existing features, adding more features to the software, and working on non-functional aspects of the software (e.g. increasing scalability) as the user base grows.
The foundation of the software is now in place. During this phase, the software is typically under development by one or more dedicated teams.
Maintenance phase
In the Maintenance phase, the code base is typically brought under the responsibility of a development team that maintains multiple code bases (no dedicated team). The ability of this team to make changes to the existing software depends on the degree to which knowledge of the code base is still available in the team, as well as the quality of the code base, documentation, and integrity of the architecture.
Typical activities that are performed in this phase are handling small change requests bug fixes, and keeping the underlying software libraries, frameworks, and other infrastructure components up to date.
Decommissioning phase
In this phase, it is time to execute change activities that are needed for the sunset of the software system. Functionality and users are migrated to other systems.
No major changes are typically made to the code base at this stage, other than changes that are needed for phasing out specific functionality or to keep the software in a safe and secure state (e.g. patching security vulnerabilities).
End-of-life phase
In this phase, the software system is switched off and no more changes are made to the software. The code base and related artifacts are safely archived.
The yearly growth and change rate during the software development life cycle phases
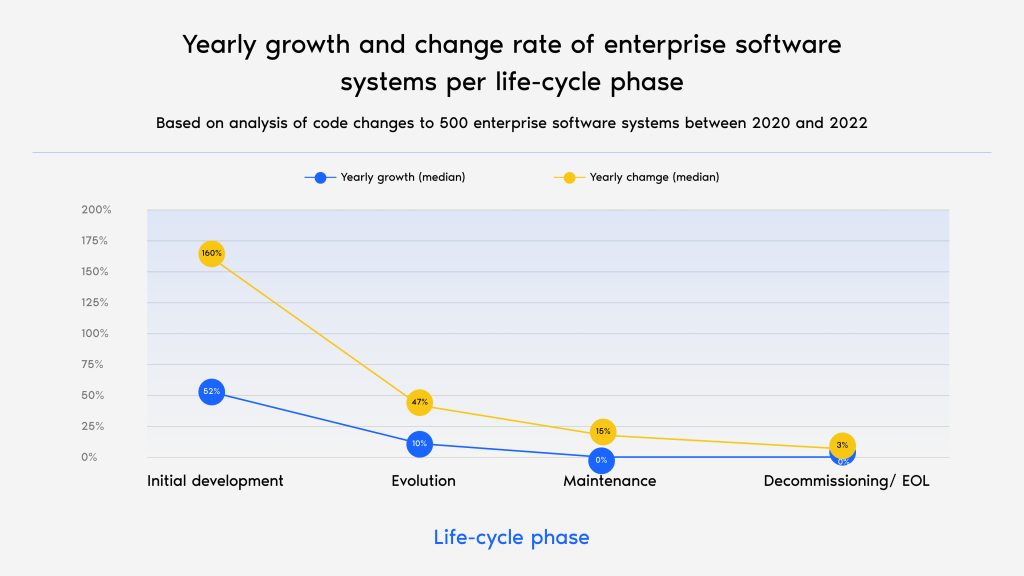
The graph above shows that enterprise software systems in different life cycle phases have very different growth and change characteristics.
- The blue line stands for the yearly growth rate: A percentage that indicates the yearly growth of code volume.
- The yellow line stands for the yearly change rate: A percentage that indicates the number of changes done to existing code.
Initial Development Phase
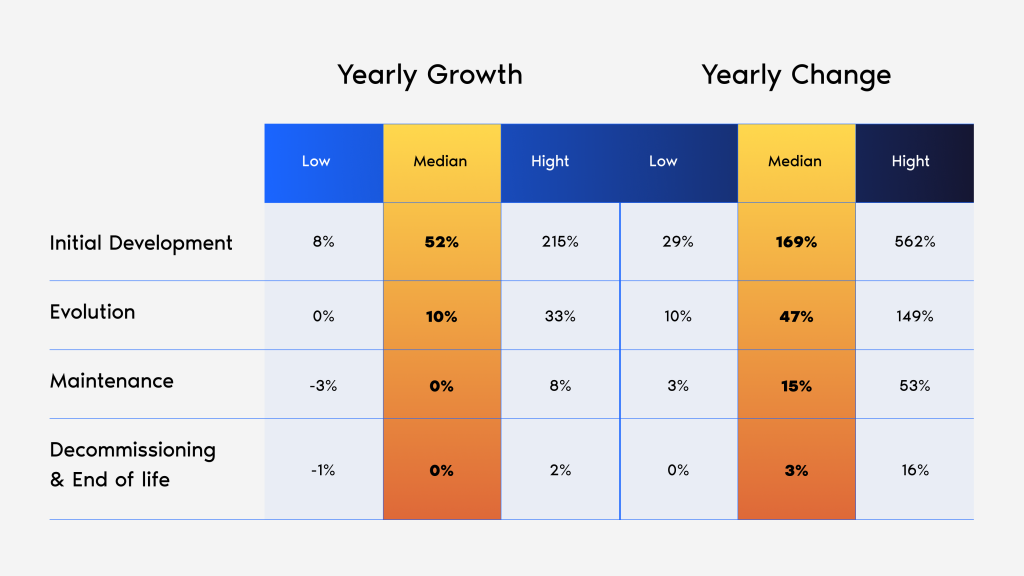
As expected, significant growth (52%) and change (168%) tend to occur during this phase, with a large variance in the data. Code bases can double, triple, or even quadruple in code volume every year as new code is added and existing code is modified.
Evolution phase
Growth of systems in this phase now stabilizes to about 10% per year, while existing code still changes at a significant rate of 47% per year. This indicates that many modifications to existing functionality are made in this phase while still adding new features.
Maintenance phase
In this phase, typically 15% of the existing code is changed yearly, while the growth in terms of code volume stagnates (with a median of 0% yearly growth and a variance of -3% to 8% growth per year). This is an indication that only small change requests, bug fixes, and security patches are performed, while the addition of new functionality is very limited in this phase.
Decommissioning phase
As expected, in this phase code bases have typically stopped growing (median of 0% with a very small variance). Also, the yearly change rate drops to 3%, indicating only changes are made that are needed to either keep the lights on or switch off functionality.
Recommendations based on code changes during the software development life cycle phases
Based on the findings in our Benchmark 2023 report, it’s clear that the software lifecycle phases have a major impact on yearly growth and change rates.
Based on these findings, we have two high-level recommendations:
1. Lifecycle phases of enterprise software should be defined and tracked
Organizations should further rationalize software portfolio management by making lifecycle phases explicit for each software system. Following that, year-over-year tracking of code growth and change rates should be evaluated against known benchmarks, such as the dataset presented in this article and the Benchmark 2023 report.
2. Leverage insights to improve decision-making
With the first part in place, software estimations should be enhanced following defined lifecycle phases. Code growth and change are major factors in the effort necessary to maintain and enhance the software. We advise fine-tuning and using these metrics in budgeting, decision-making, and portfolio roadmap design.
Of course, the findings shared in this article should be used as initial guidance.
To adequately forecast a specific system of your organization’s software portfolio, a more detailed analysis will be required. For more information about this or our software quality assurance platform, Sigrid, please visit our website.
Optimize your SDLC by proactively managing technical debt
Effectively managing software throughout its life cycle is essential for maintaining system integrity and achieving business objectives. Each phase—from initial development to end-of-life—introduces specific challenges that can lead to technical debt if not properly addressed.
A Software Portfolio Scan provides IT leaders with a comprehensive analysis of their software portfolio, identifying hidden risks, assessing technical debt, and offering actionable recommendations. This proactive approach enables organizations to optimize resource allocation, reduce maintenance costs, and ensure their software systems remain robust and aligned with strategic goals.