Updated Findings
New data shows no impact of COVID-19 on code quality nor production, as both have held relatively steady since April.
Looking at the fresh data, what we’re seeing now in the fourth quarter of the year could still be very much in line with the results from April.
It’s a plausible assumption that most development teams have continued working from home as they were during the initial lockdown. In all regions where SIG has offices, governments have been strongly recommending working from home and many employers have complied. Even more traditional organizations, such as banks, quickly and radically made the shift. Perhaps we are witnessing one of the more radical changes in (office) work in recent history, as McKinsey reports. Obviously, it would be fraught to claim that we have already made our way through. The virus is still at large, and further policy changes are still to come, no doubt. We cannot yet see the full impact this is having on the way we develop software, but it’s nonetheless important to start the assessment.
At SIG, we monitor hundreds of software projects as the code is being developed. As mentioned above, the 2020 SIG Benchmark Report includes findings around two key software development metrics:
- build quality: the monthly deltas in maintainability score as measured by the SIG ISO 25010:2011 Maintainability Model
- code production: the monthly deltas in code volume
For both metrics, we observed a spike in March, when most coronavirus restrictions were in place. However, the spike was in a positive direction, with, surprisingly, many projects performing better than normal.
We now include seven more months of data, and in addition, we split the data by system volume. We also added a measure of changes to existing code. In total, we now report on 575 projects for the period of November 2019 through October 2020, with each project measured in every one of these months.
Build quality
In Figures 1 and 2, we plot the mean project performance for maintainability and code production, respectively. We’ll use March as a demarcation point in the data again, marked by a dashed vertical line for easy reference.
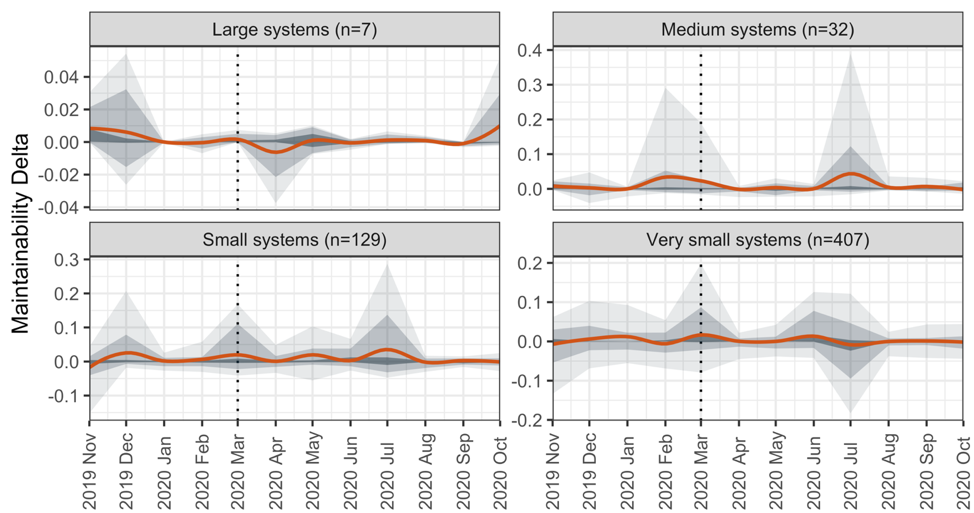
Figure 1. Mean project performance with respect to deltas in maintainability. The bold orange line is the monthly mean, surrounded by bands representing increasingly large proportions (50%, 80%, 90%) of projects. Maintainability is measured on a scale of 1 to 5 stars.
Let’s have a look at the trends in Figure 1. At first glance, are there big differences in the averages before and from March onward when the COVID-19 restrictions were in effect? Not really. It looks like business-as-usual, mostly. The bump in March is indeed visible, apparently mostly smaller systems pulled up the mean maintainability performance somewhat. At the same time, such bumps are not really unique; they happened in December 2019 in the case of large systems (although the deltas are typically much smaller in that category due to large code bases needing more work to change), and notably in July as well.
Looking at the complete picture, the maintainability deltas are hovering around zero for most of the months, pre- or post-March, suggesting quality levels are maintained. Perhaps deltas are above zero slightly more often, but considering natural levels of variation in data, at this point, we see no evidence of a big quality spike or breakdown, for that matter.
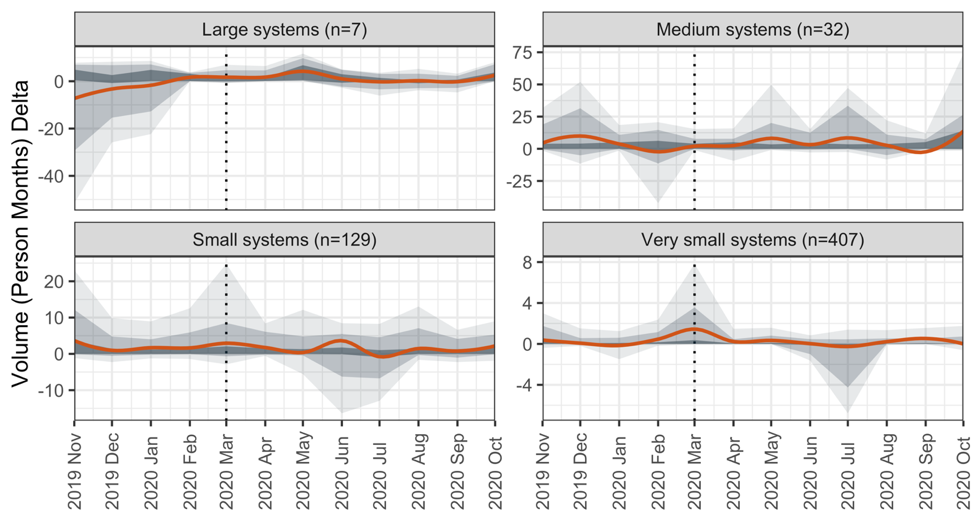
Figure 2. Mean project performance with respect to code production, or deltas in code volume. The bold orange line is the monthly mean, surrounded by bands representing increasingly large proportions (50%, 80%, 90%) of projects. Volume is measured in Person Months, a normalized metric across programming technologies.
Code production and change
There are some caveats that need to be mentioned here, as code production can be a tricky topic in software development. Code production as we refer to here is not meant to be interpreted as full-fledged software development productivity, which is a term far broader in scope. Software development is often not just about writing code, despite code being the most valuable deliverable. A productive day, week, or even month in software development can also consist of figuring out exactly what and how to build, changing existing code, and testing if that code is working correctly. With code production, we are selecting just one of the variables of the productivity construct. Code production also has a habit of going into the negative, which is not always a sign of lower productivity. Old code is sometimes thrown out, or renovated to much more concise lengths. Of course, projects tend to have a positive net code production in most of their months.
What do the data in Figure 2 tell us? A report from Bao et. al. stated that for large projects (where “large projects” are defined as involving more than 20 developers), productivity seemed to go down once they shifted to working from home. It is interesting to compare this data to that observation; however, caution is needed because definitions can be subtly different. The way we categorize projects here is based on the size of the existing code bases and our estimate of the number of developers needed to maintain them. Our “large” category runs from approximately 10 to 50 developers. For such systems, and medium-sized systems as well, the mean code production seems to take no immediate hit in the months following March, actually increasing slightly up to May. The small and very small systems show the bump upward in March, as we reported in the 2020 Benchmark Report, but they do peter out slowly and even drop into the negative around July. Perhaps those drops indicate more code clean-up activities taking place over the summer, or some productivity brakes were indeed starting to kick in.
So far, we have observed that the pandemic impact on the net production of code appears negligible. But what about the changes made to code that did not necessarily led to an increase or decrease in volume? Very commonly, software developers change existing code in place to fix issues, improve code, or to fit in new features. Generally, that’s a healthy phenomenon. Figure 3 shows the mean code change over time, revealing again that the pace of development does not seem to have been impacted much by the onset of the pandemic. In larger systems, there may even have been a greater amount of changes than before. The other size categories seem to carry on mostly as normal.
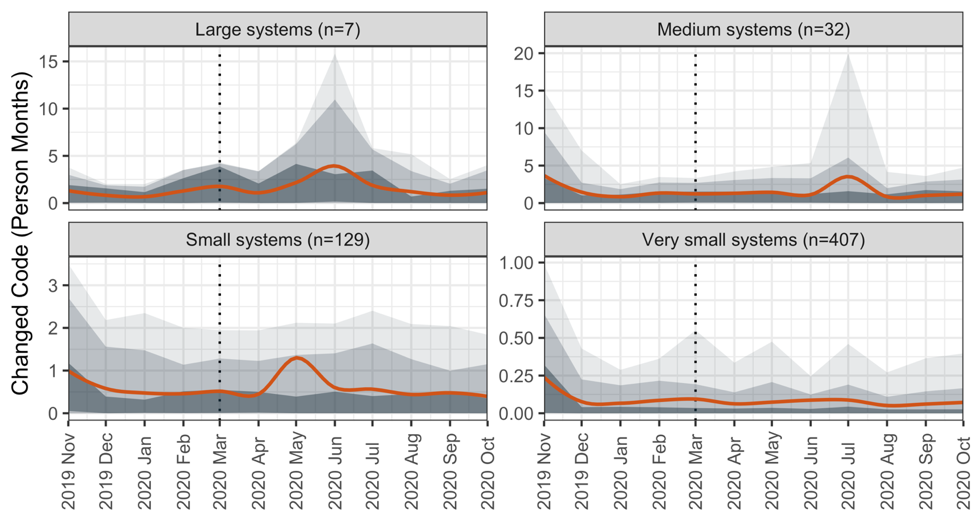
Figure 3. Mean project performance with respect to changed code, measured on a line-by-line basis. The bold orange line is the monthly mean, surrounded by bands representing increasingly large proportions (50%, 80%, 90%) of projects.
The Impacts of Remote Work on Well-Being
Additional research underscores link between productivity and developers’ mental and physical health
While we have seen that build quality and code production have remained stable since April, some important considerations still remain. Let’s consider some recent research from various parties around the globe.
Ralph et. al. performed an in-depth survey of more than 2,000 software developers across 53 countries, focusing on the radical shift to the home office. Their respondents report that their productivity on average went down, along with their overall well-being, which are intertwined.
In the above-mentioned Bao et. al. report, a detailed time record analysis was conducted at Baidu, a Chinese tech giant. They report that “The productivity of the majority of developers when working from home is similar to that when working onsite” but also that “Working from home has a larger impact on developer productivity for large projects than small projects.”
The Octoverse Spotlight from GitHub reports on an analysis of the first three months of 2020, observing that productivity had not significantly decreased when compared to the same period in 2019. They do see an increase in collaborative feature usage in open source projects, as well as a shift in work cadence. Developers appear to be working longer hours, raising concerns for their health as well, both mental and physical.
Conclusion
The COVID-19 pandemic has pushed health care providers to the limit, dragged down the global economy, and brought many other aspects of life and business to a standstill. Yet, software development seems to remain relatively unaffected amid the disruption.
Based on our data, we are not observing massive pandemic-related declines in code quality, nor in code production and change rates. In a way, we are quite surprised by these findings. Software development has aspects of both solitary work and highly social endeavors. Conway’s Law, for instance, claims that “Any organization that designs a system will produce a design whose structure is a copy of the organization’s communication structure.” The pandemic surely will have impacted the communication structures of development organizations, and an impact on their software systems can therefore be expected in the long run. Apparently, we cannot yet observe any big impact of such changes, but it doesn’t hurt to keep looking for longer term trends.
There is yet another reason to exercise caution. As Ralph et. al. and GitHub’s Octoverse Spotlight point out, there are threats to the mental and physical health of software developers working almost entirely from home. And their well-being is closely connected to the construct of software productivity. Simply put, keeping teams happy and productive are two sides of the same coin. It is certainly possible to spot software productivity declines by looking at the software metrics, but at that point, it may be too late.